Uber Results Presentation Deck
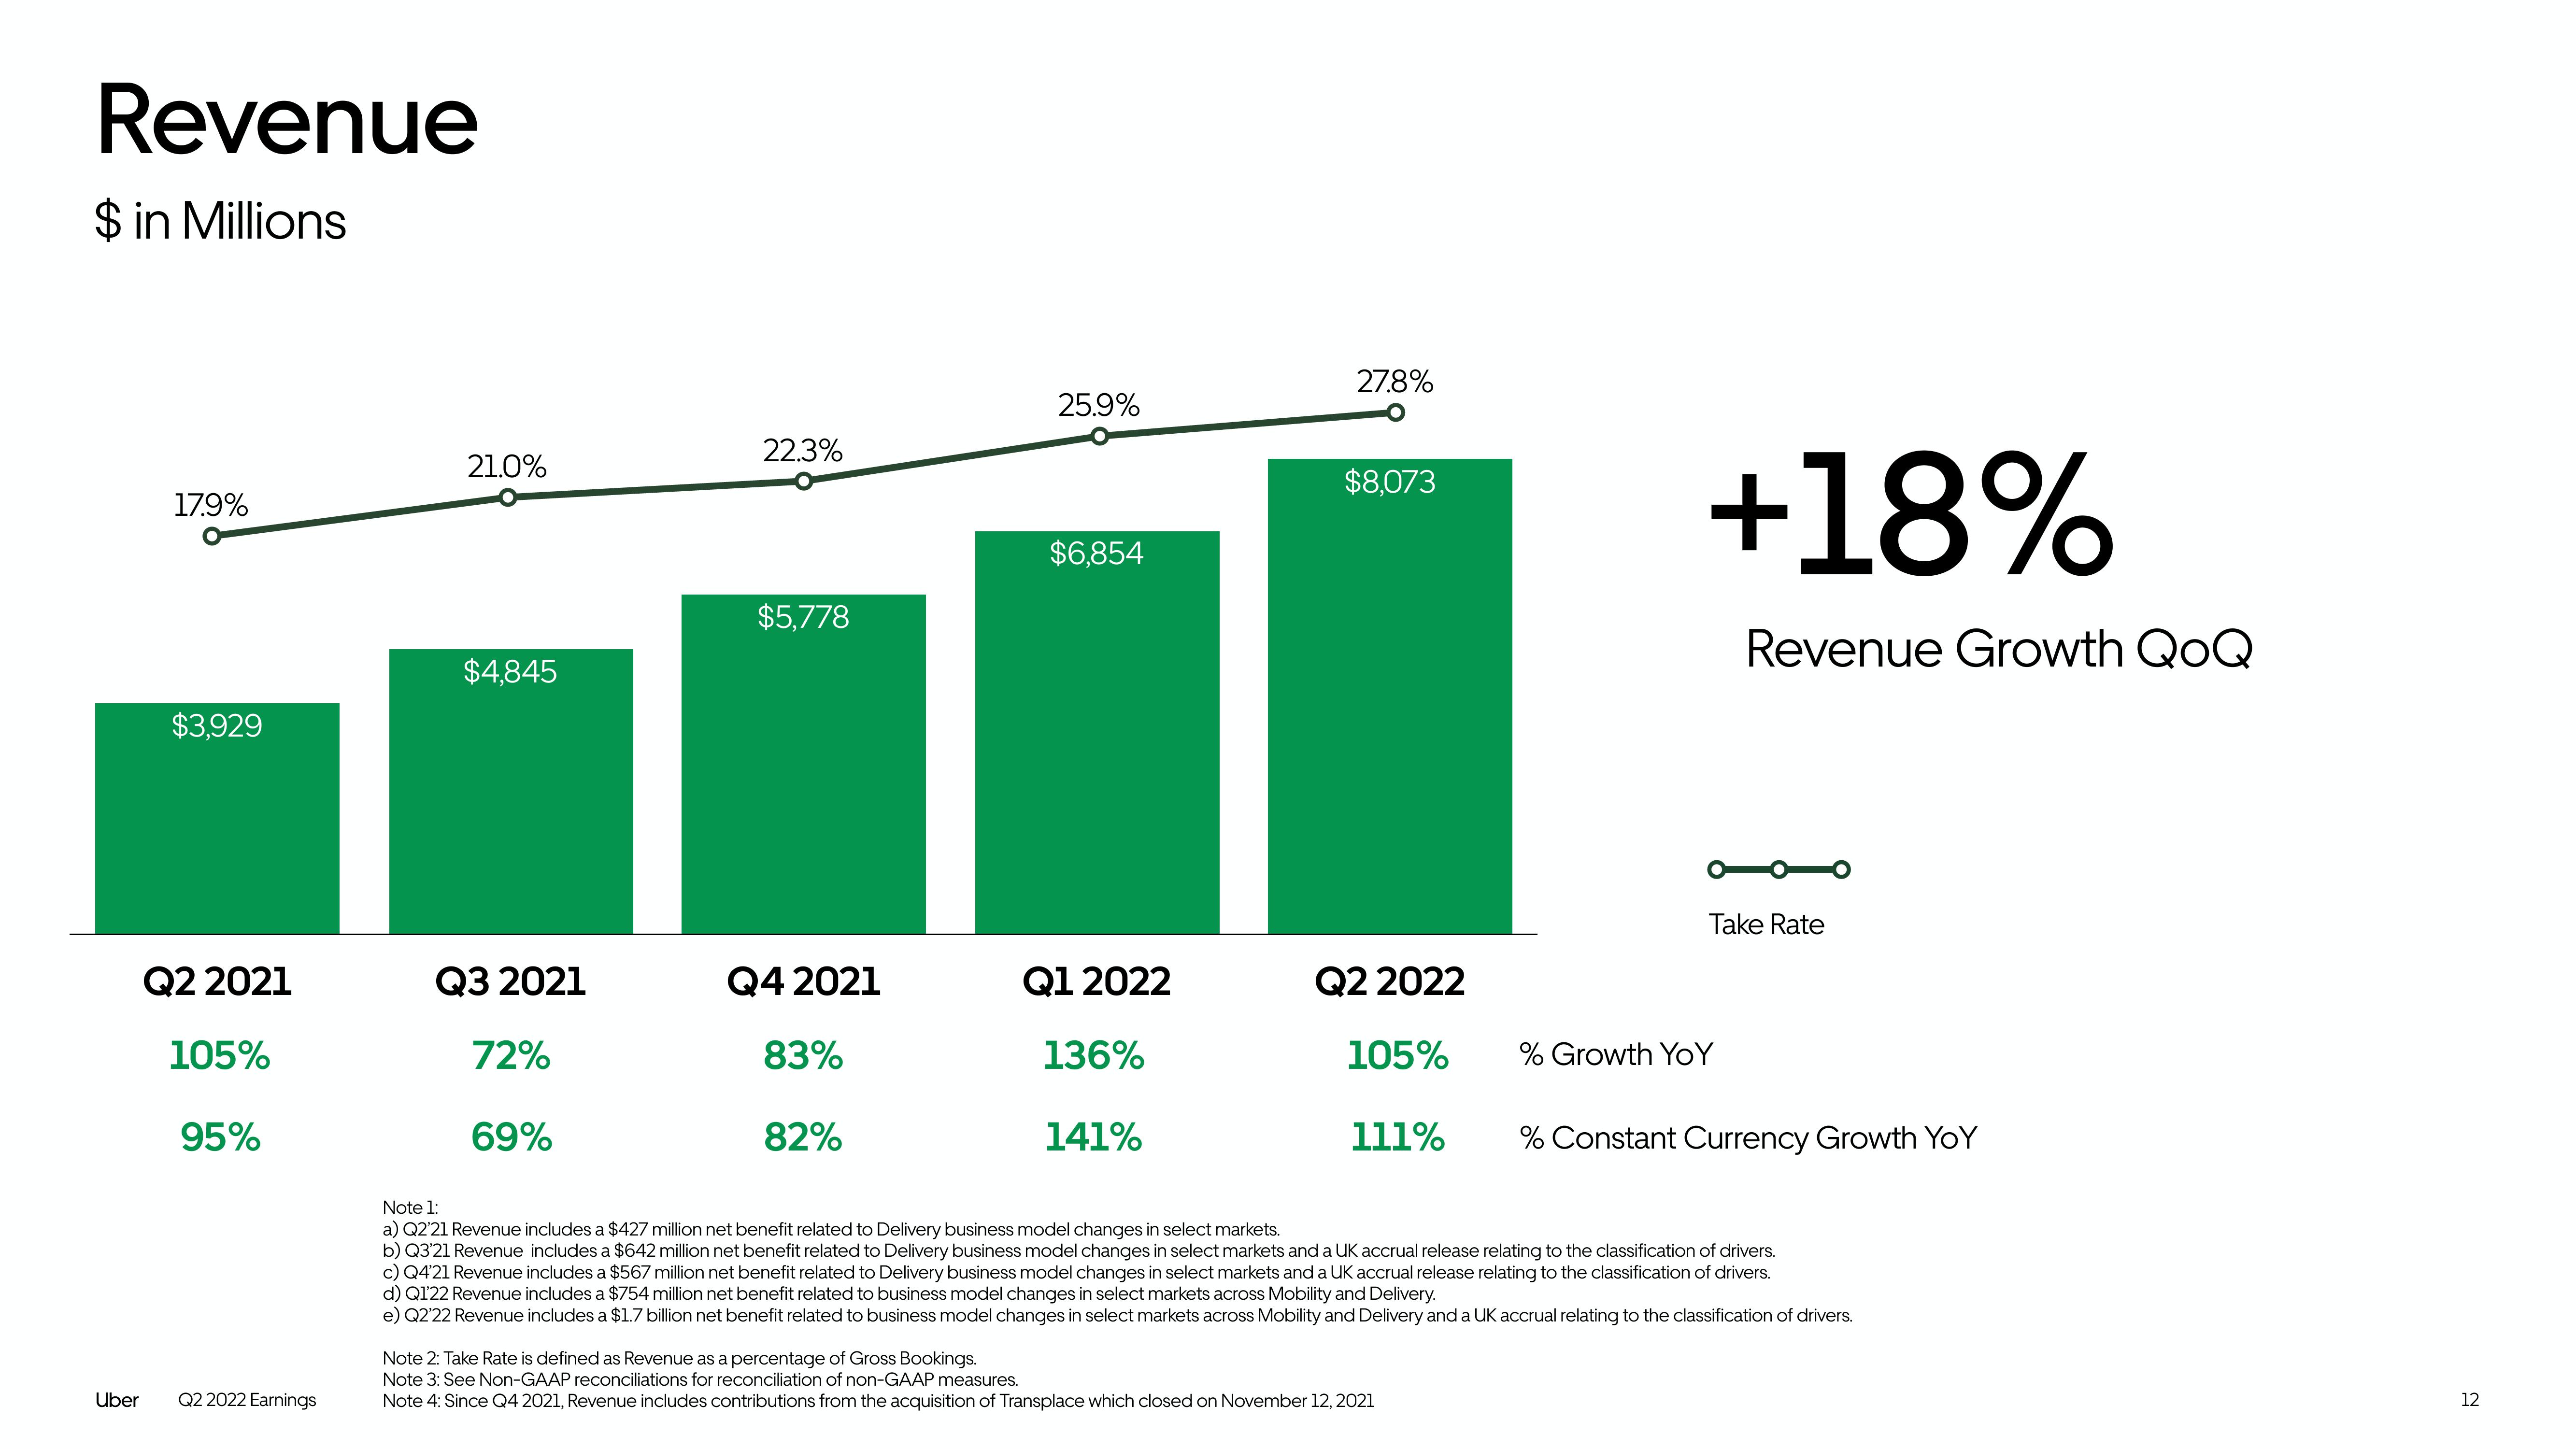
Revenue
$ in Millions
Uber
17.9%
$3,929
Q2 2021
105%
95%
Q2 2022 Earnings
21.0%
$4,845
Q3 2021
72%
69%
22.3%
$5,778
Q4 2021
83%
82%
25.9%
$6,854
Q1 2022
136%
141%
27.8%
$8,073
Q2 2022
105%
111%
+18%
Revenue Growth QoQ
Take Rate
Note 2: Take Rate is defined as Revenue as a percentage of Gross Bookings.
Note 3: See Non-GAAP reconciliations for reconciliation of non-GAAP measures.
Note 4: Since Q4 2021, Revenue includes contributions from the acquisition of Transplace which closed on November 12, 2021
% Growth YoY
% Constant Currency Growth YoY
Note 1:
a) Q2'21 Revenue includes a $427 million net benefit related to Delivery business model changes in select markets.
b) Q3'21 Revenue includes a $642 million net benefit related to Delivery business model changes in select markets and a UK accrual release relating to the classification of drivers.
c) Q4'21 Revenue includes a $567 million net benefit related to Delivery business model changes in select markets and a UK accrual release relating to the classification of drivers.
d) Q1'22 Revenue includes a $754 million net benefit related to business model changes in select markets across Mobility and Delivery.
e) Q2'22 Revenue includes a $1.7 billion net benefit related to business model changes in select markets across Mobility and Delivery and a UK accrual relating to the classification of drivers.
12View entire presentation