Affirm Investor Day Presentation Deck
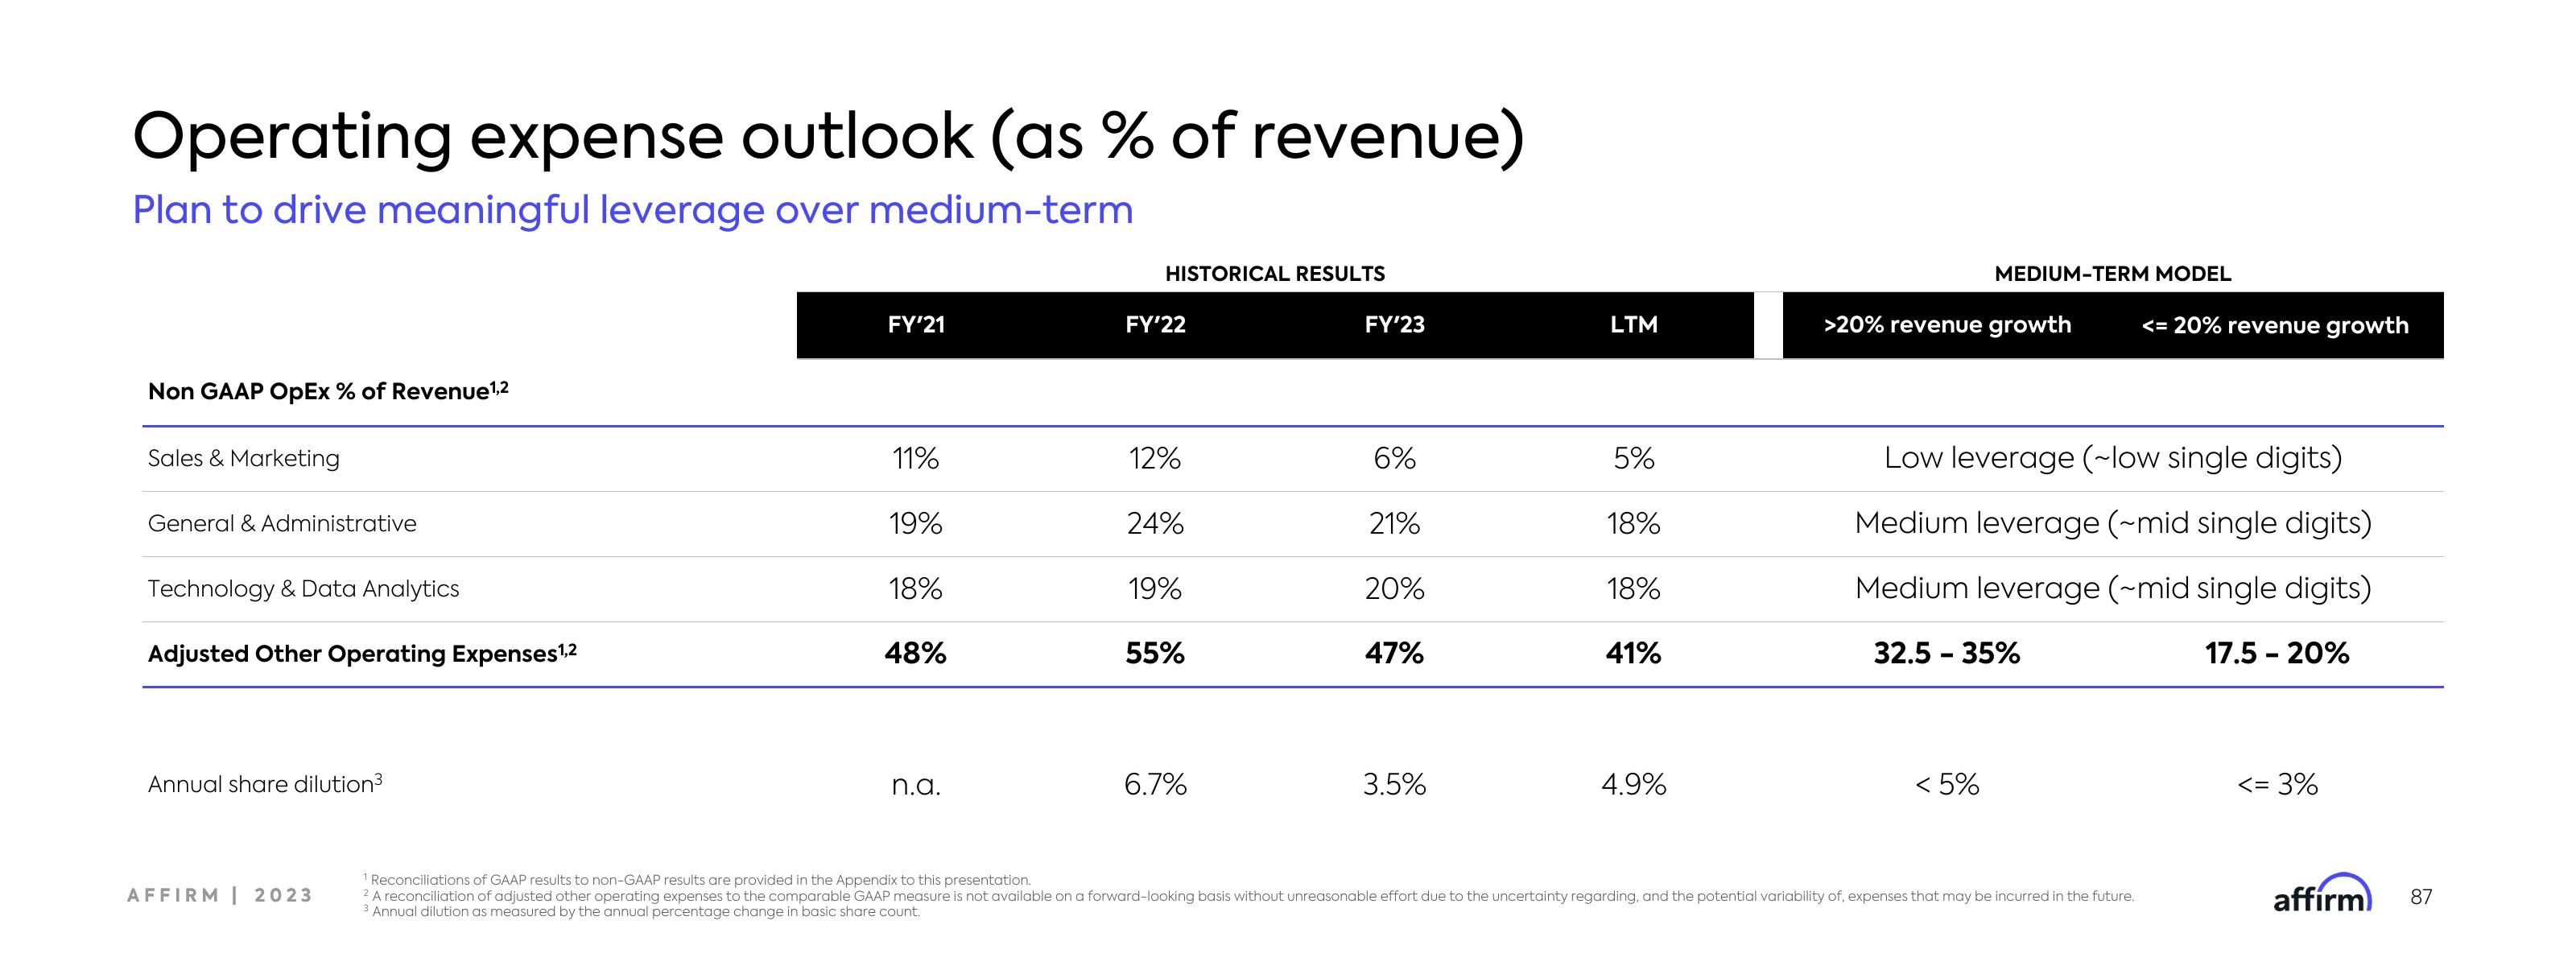
Operating expense outlook (as % of revenue)
Plan to drive meaningful leverage over medium-term
Non GAAP OPEx % of Revenue ¹,2
Sales & Marketing
General & Administrative
Technology & Data Analytics
Adjusted Other Operating Expenses ¹,2
Annual share dilution³
AFFIRM | 2023
FY'21
11%
19%
18%
48%
n.a.
HISTORICAL RESULTS
FY'22
12%
24%
19%
55%
6.7%
FY'23
6%
21%
20%
47%
3.5%
LTM
5%
18%
18%
41%
4.9%
MEDIUM-TERM MODEL
>20% revenue growth
Low leverage (~low single digits)
Medium leverage (~mid single digits)
Medium leverage (~mid single digits)
32.5-35%
< 5%
<= 20% revenue growth
1 Reconciliations of GAAP results to non-GAAP results are provided in the Appendix to this presentation.
2 A reconciliation of adjusted other operating expenses to the comparable GAAP measure is not available on a forward-looking basis without unreasonable effort due to the uncertainty regarding, and the potential variability of, expenses that may be incurred in the future.
3 Annual dilution as measured by the annual percentage change in basic share count.
17.5-20%
<= 3%
affirm
87View entire presentation