Nareit’s REITworld 2023 Annual Conference
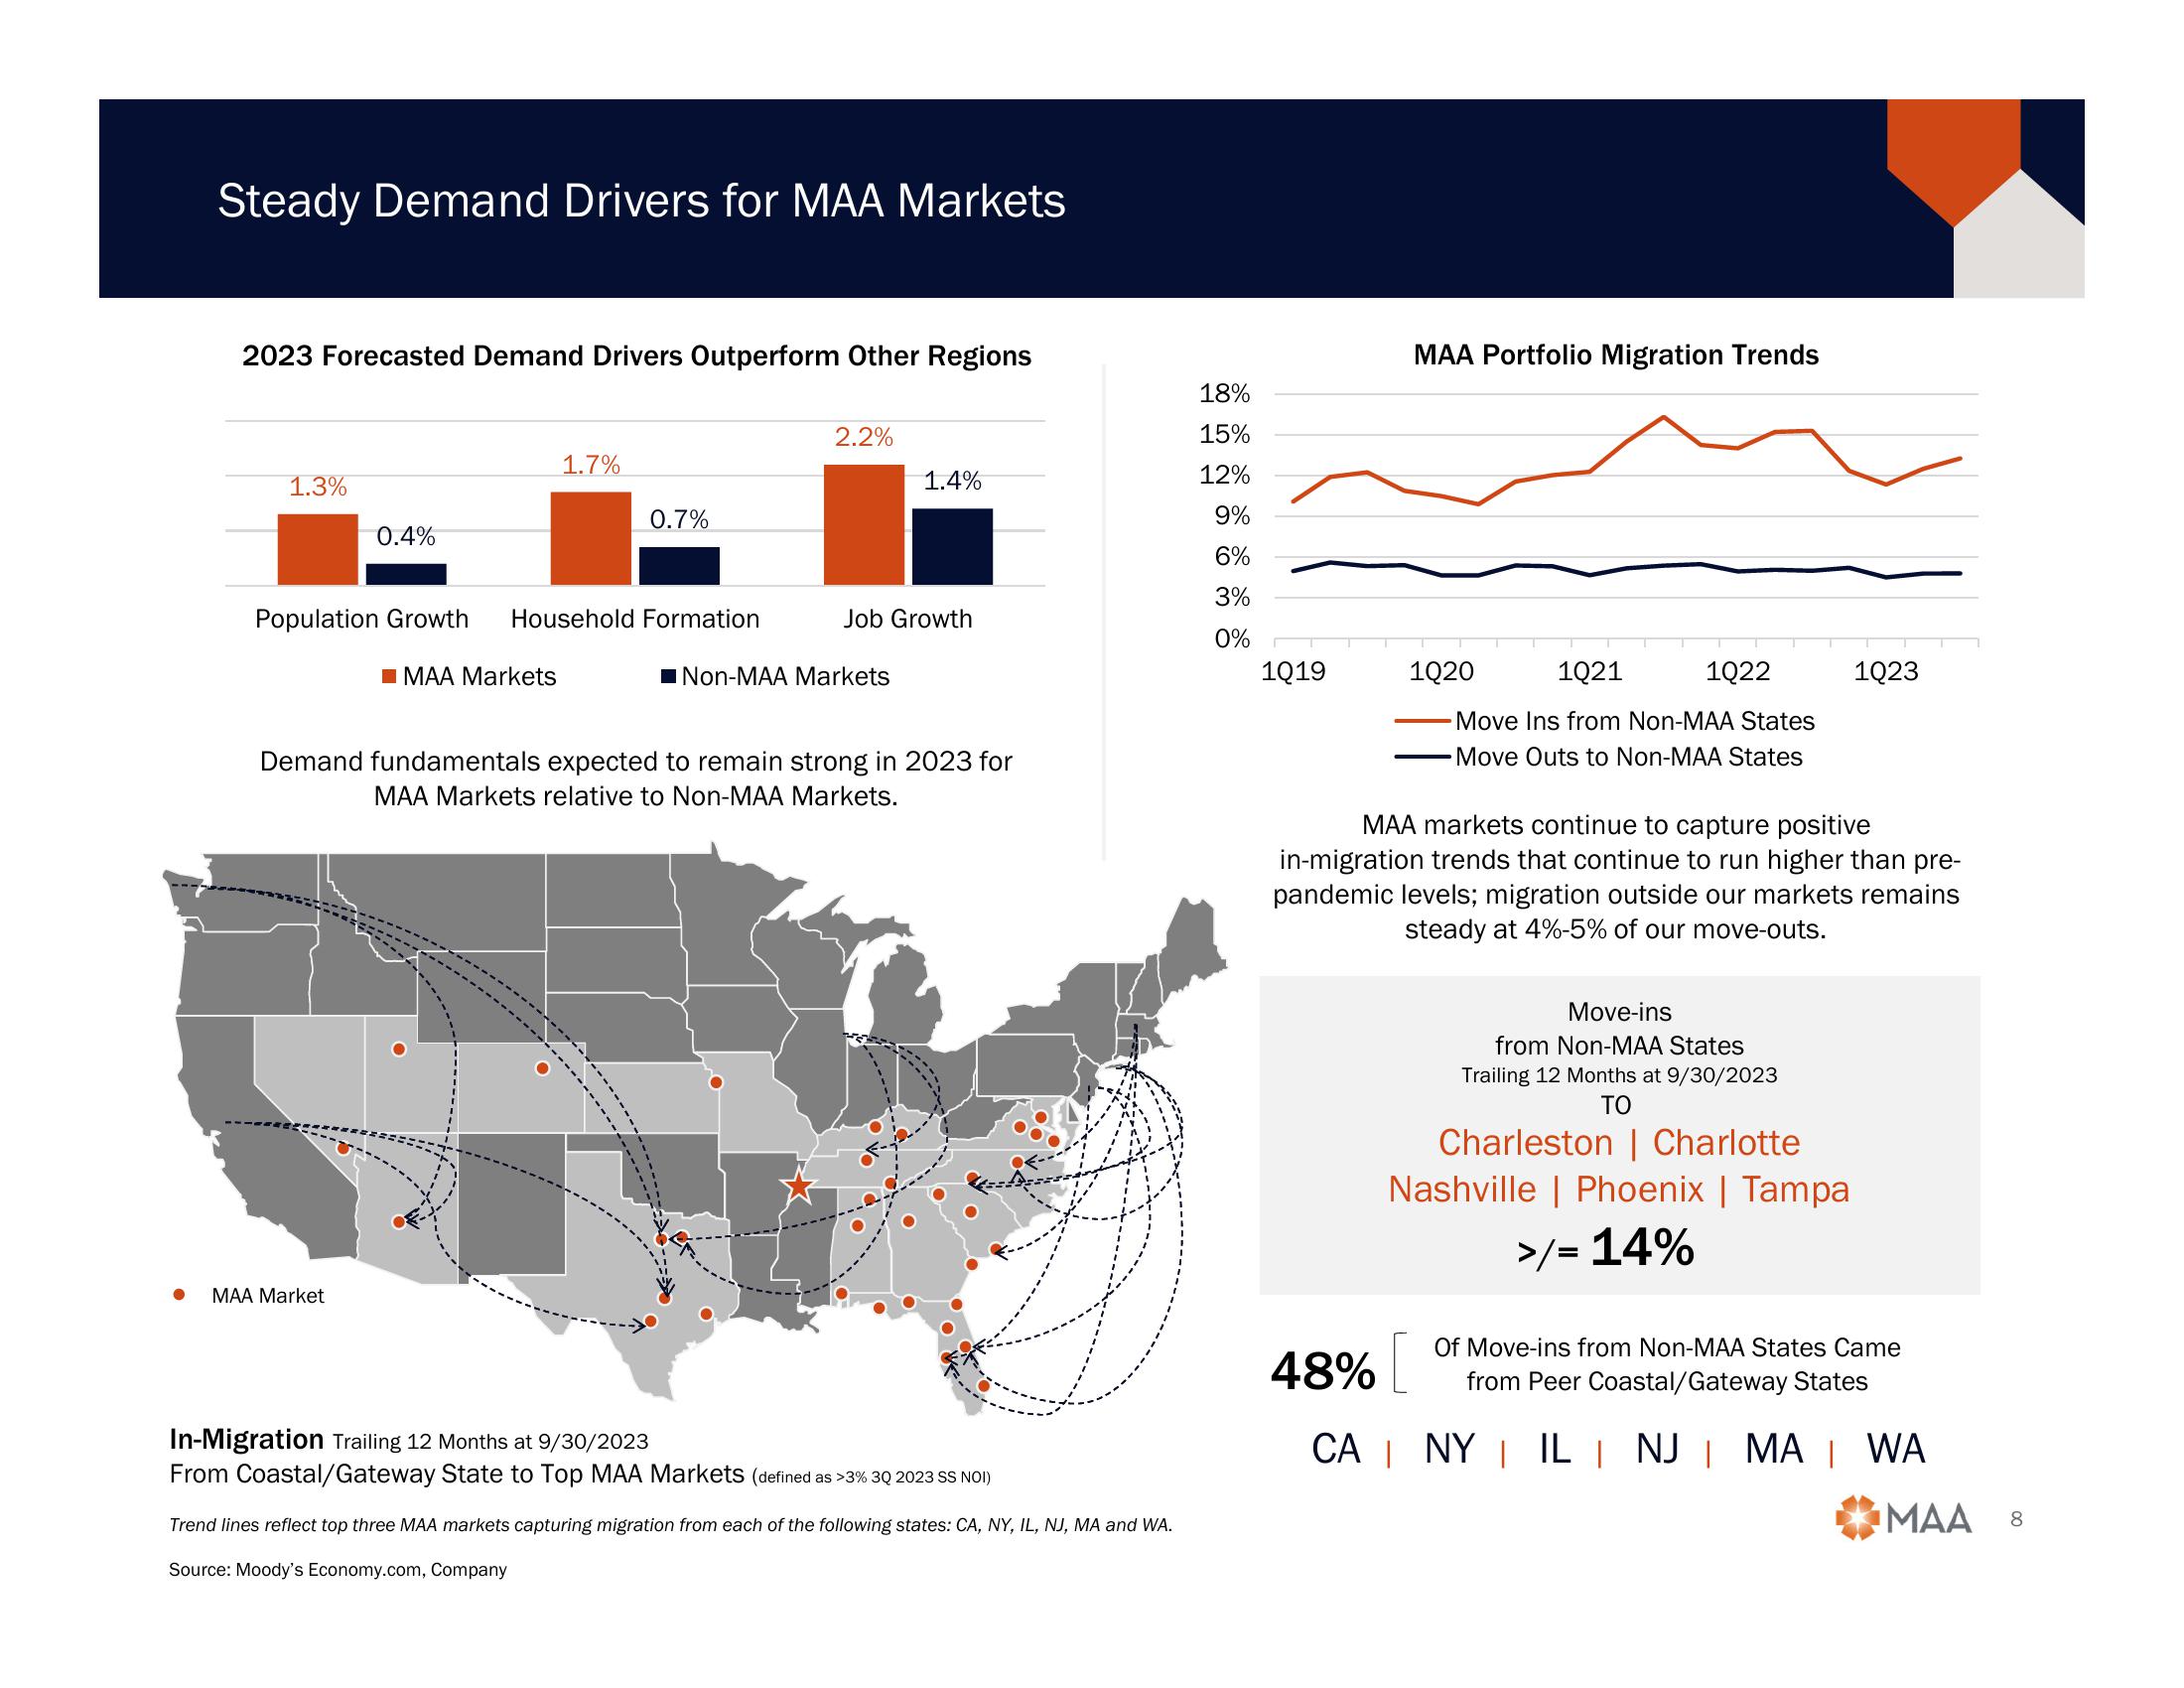
Steady Demand Drivers for MAA Markets
2023 Forecasted Demand Drivers Outperform Other Regions
1.3%
0.4%
MAA Market
1.7%
Population Growth Household Formation
■MAA Markets
0.7%
2.2%
1.4%
Job Growth
■Non-MAA Markets
Demand fundamentals expected to remain strong in 2023 for
MAA Markets relative to Non-MAA Markets.
In-Migration Trailing 12 Months at 9/30/2023
From Coastal/Gateway State to Top MAA Markets (defined as >3% 3Q 2023 SS NOI)
Trend lines reflect top three MAA markets capturing migration from each of the following states: CA, NY, IL, NJ, MA and WA.
Source: Moody's Economy.com, Company
18%
15%
12%
9%
6%
3%
0%
1019
MAA Portfolio Migration Trends
1Q20
48%
CA |
1021
Move Ins from Non-MAA States
Move Outs to Non-MAA States
1022
MAA markets continue to capture positive
in-migration trends that continue to run higher than pre-
pandemic levels; migration outside our markets remains
steady at 4%-5% of our move-outs.
Move-ins
from Non-MAA States
Trailing 12 Months at 9/30/2023
TO
Charleston | Charlotte
Nashville | Phoenix | Tampa
>/= 14%
1023
Of Move-ins from Non-MAA States Came
from Peer Coastal/Gateway States
NY | IL | NJ | MA | WA
MAA
8View entire presentation