Pershing Square Activist Presentation Deck
D
A Revised Proposal for Creating Value
at McDonald's
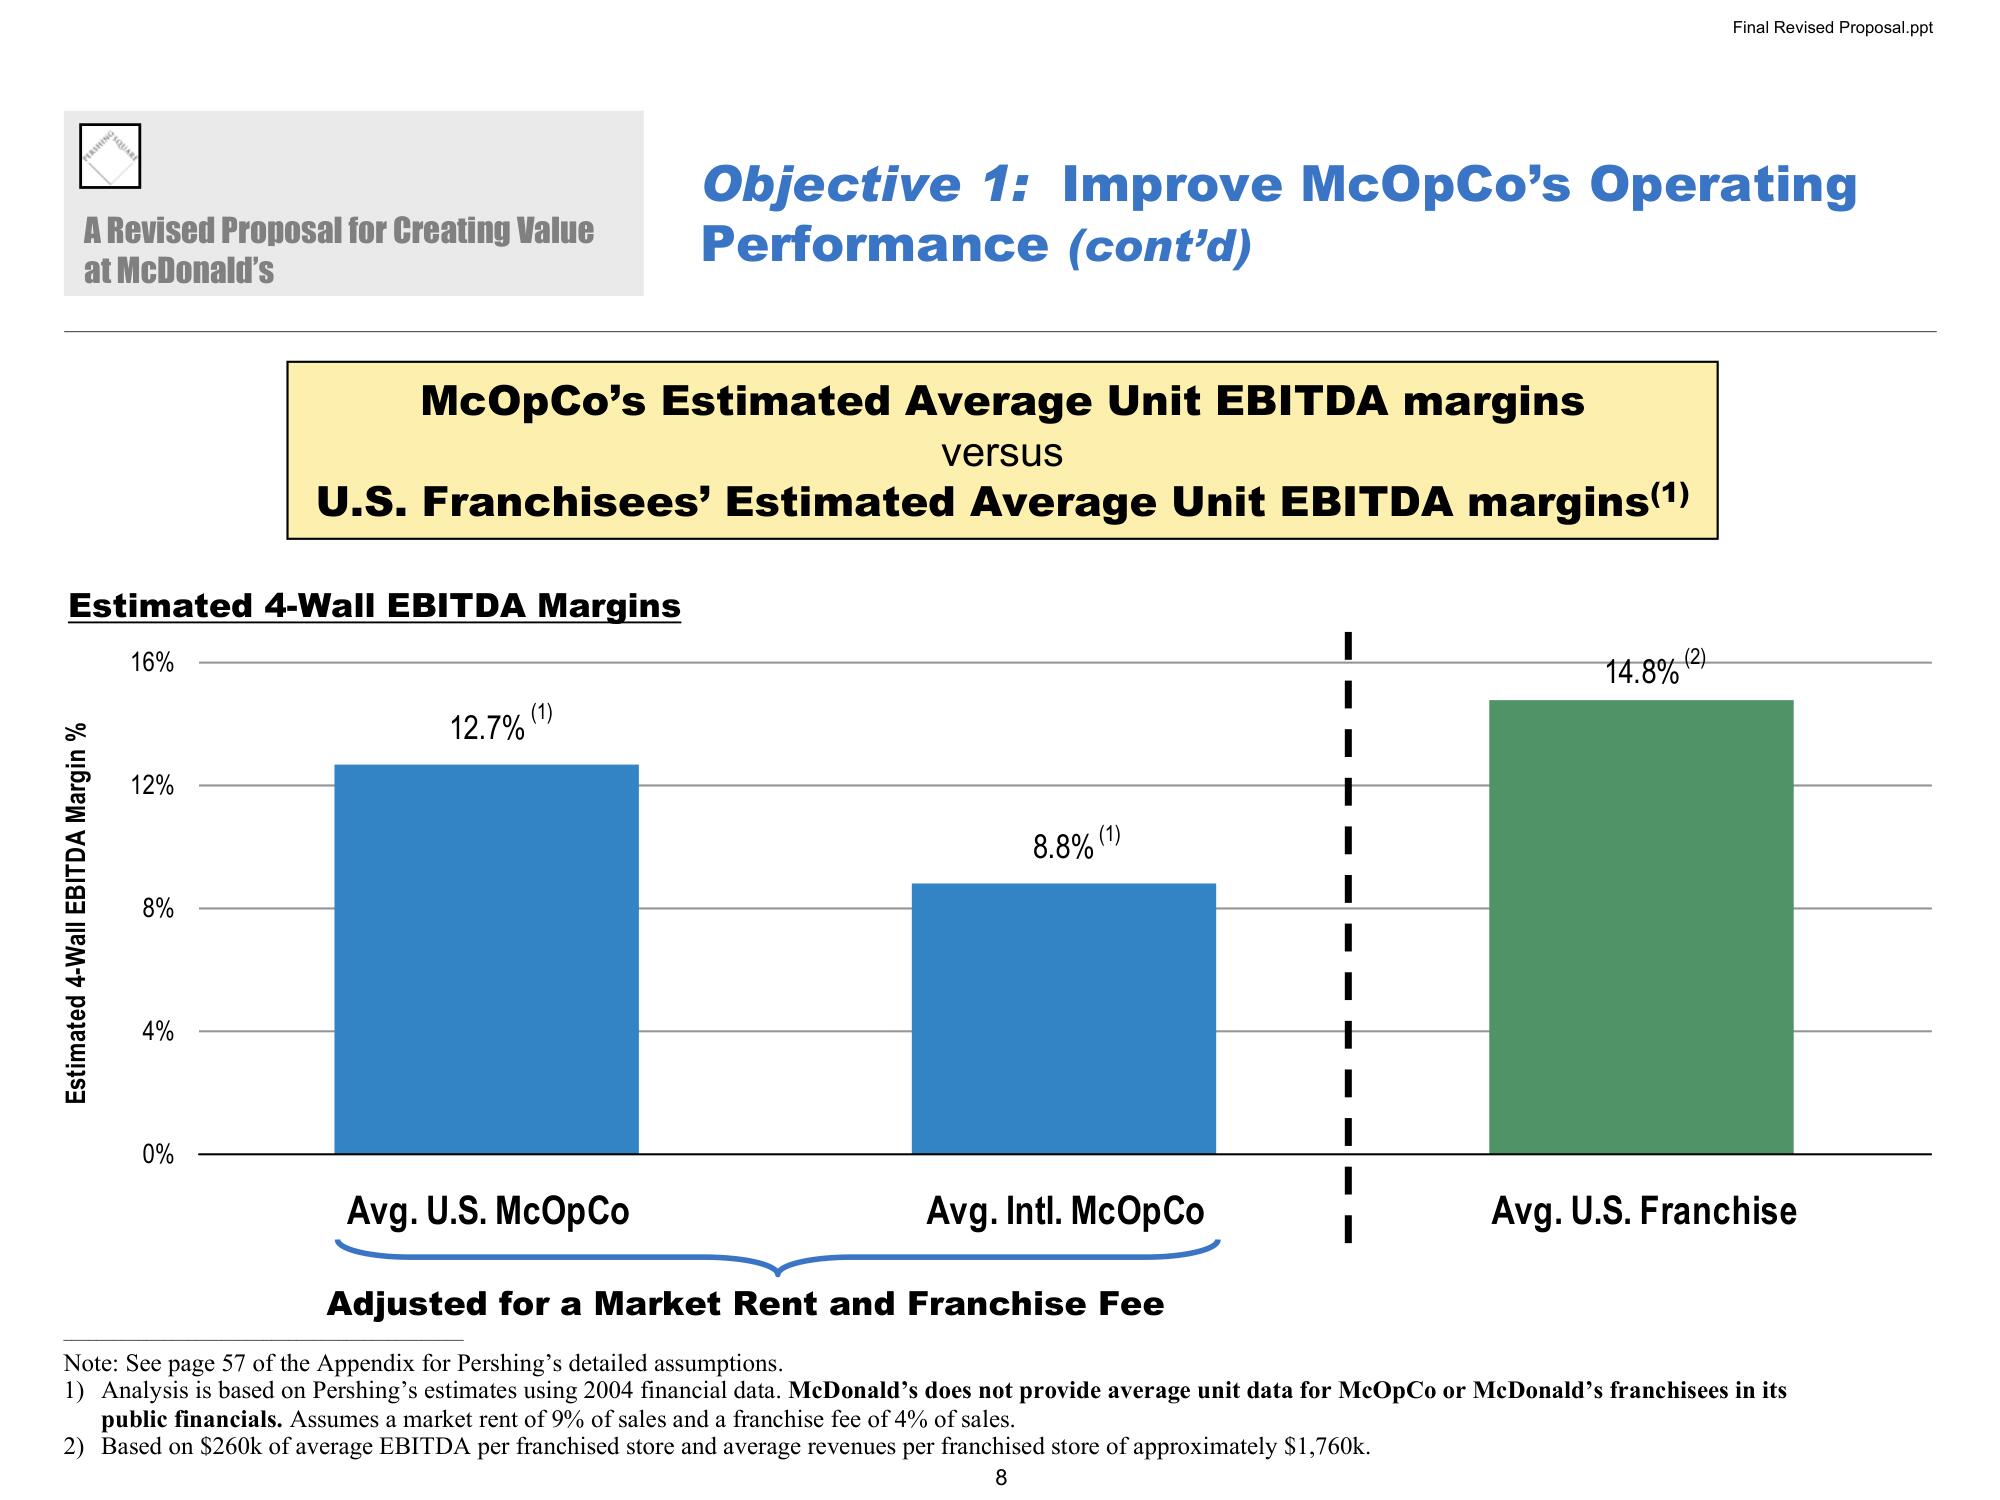
Estimated 4-Wall EBITDA Margins
16%
Estimated 4-Wall EBITDA Margin %
12%
8%
4%
0%
McOpCo's Estimated Average Unit EBITDA margins
versus
U.S. Franchisees' Estimated Average Unit EBITDA margins(¹)
12.7%
(1)
Avg. U.S. McOpCo
Objective 1: Improve McOpCo's Operating
Performance (cont'd)
8.8% (1)
Avg. Intl. McOpCo
Adjusted for a Market Rent and Franchise Fee
I
I
Final Revised Proposal.ppt
14.8% (2)
Avg. U.S. Franchise
Note: See page 57 of the Appendix for Pershing's detailed assumptions.
1) Analysis is based on Pershing's estimates using 2004 financial data. McDonald's does not provide average unit data for McOpCo or McDonald's franchisees in its
public financials. Assumes a market rent of 9% of sales and a franchise fee of 4% of sales.
2) Based on $260k of average EBITDA per franchised store and average revenues per franchised store of approximately $1,760k.
8View entire presentation