About Us
EXPERIENCED LEADERSHIP
RIGHTSIZE & STABILIZE
CULTURE DRIVEN EXECUTION
KEY TURNAROUND RESULTS*
($000's)
Balance Sheet Improvements:
Long-Term Asset Writedowns
Liability Reductions
Income Statement Changes:
Revenue
Cost of Goods Sold
Gross Margin
Gross Margin %
Operating Expenses
Income/(Loss) from Operations
Net Income
Increase/
(Decrease) From
2021
to
20
55
$
EBITDA
Cash EBITDA - Continuing Operations $
(214,018)
(53,575)
Q2 2023
8,797
4,197
4,600
52%
6,332
(1,732)
(1,442)
(597)
(804)
Ś
$
$
$
$
Ś
●
●
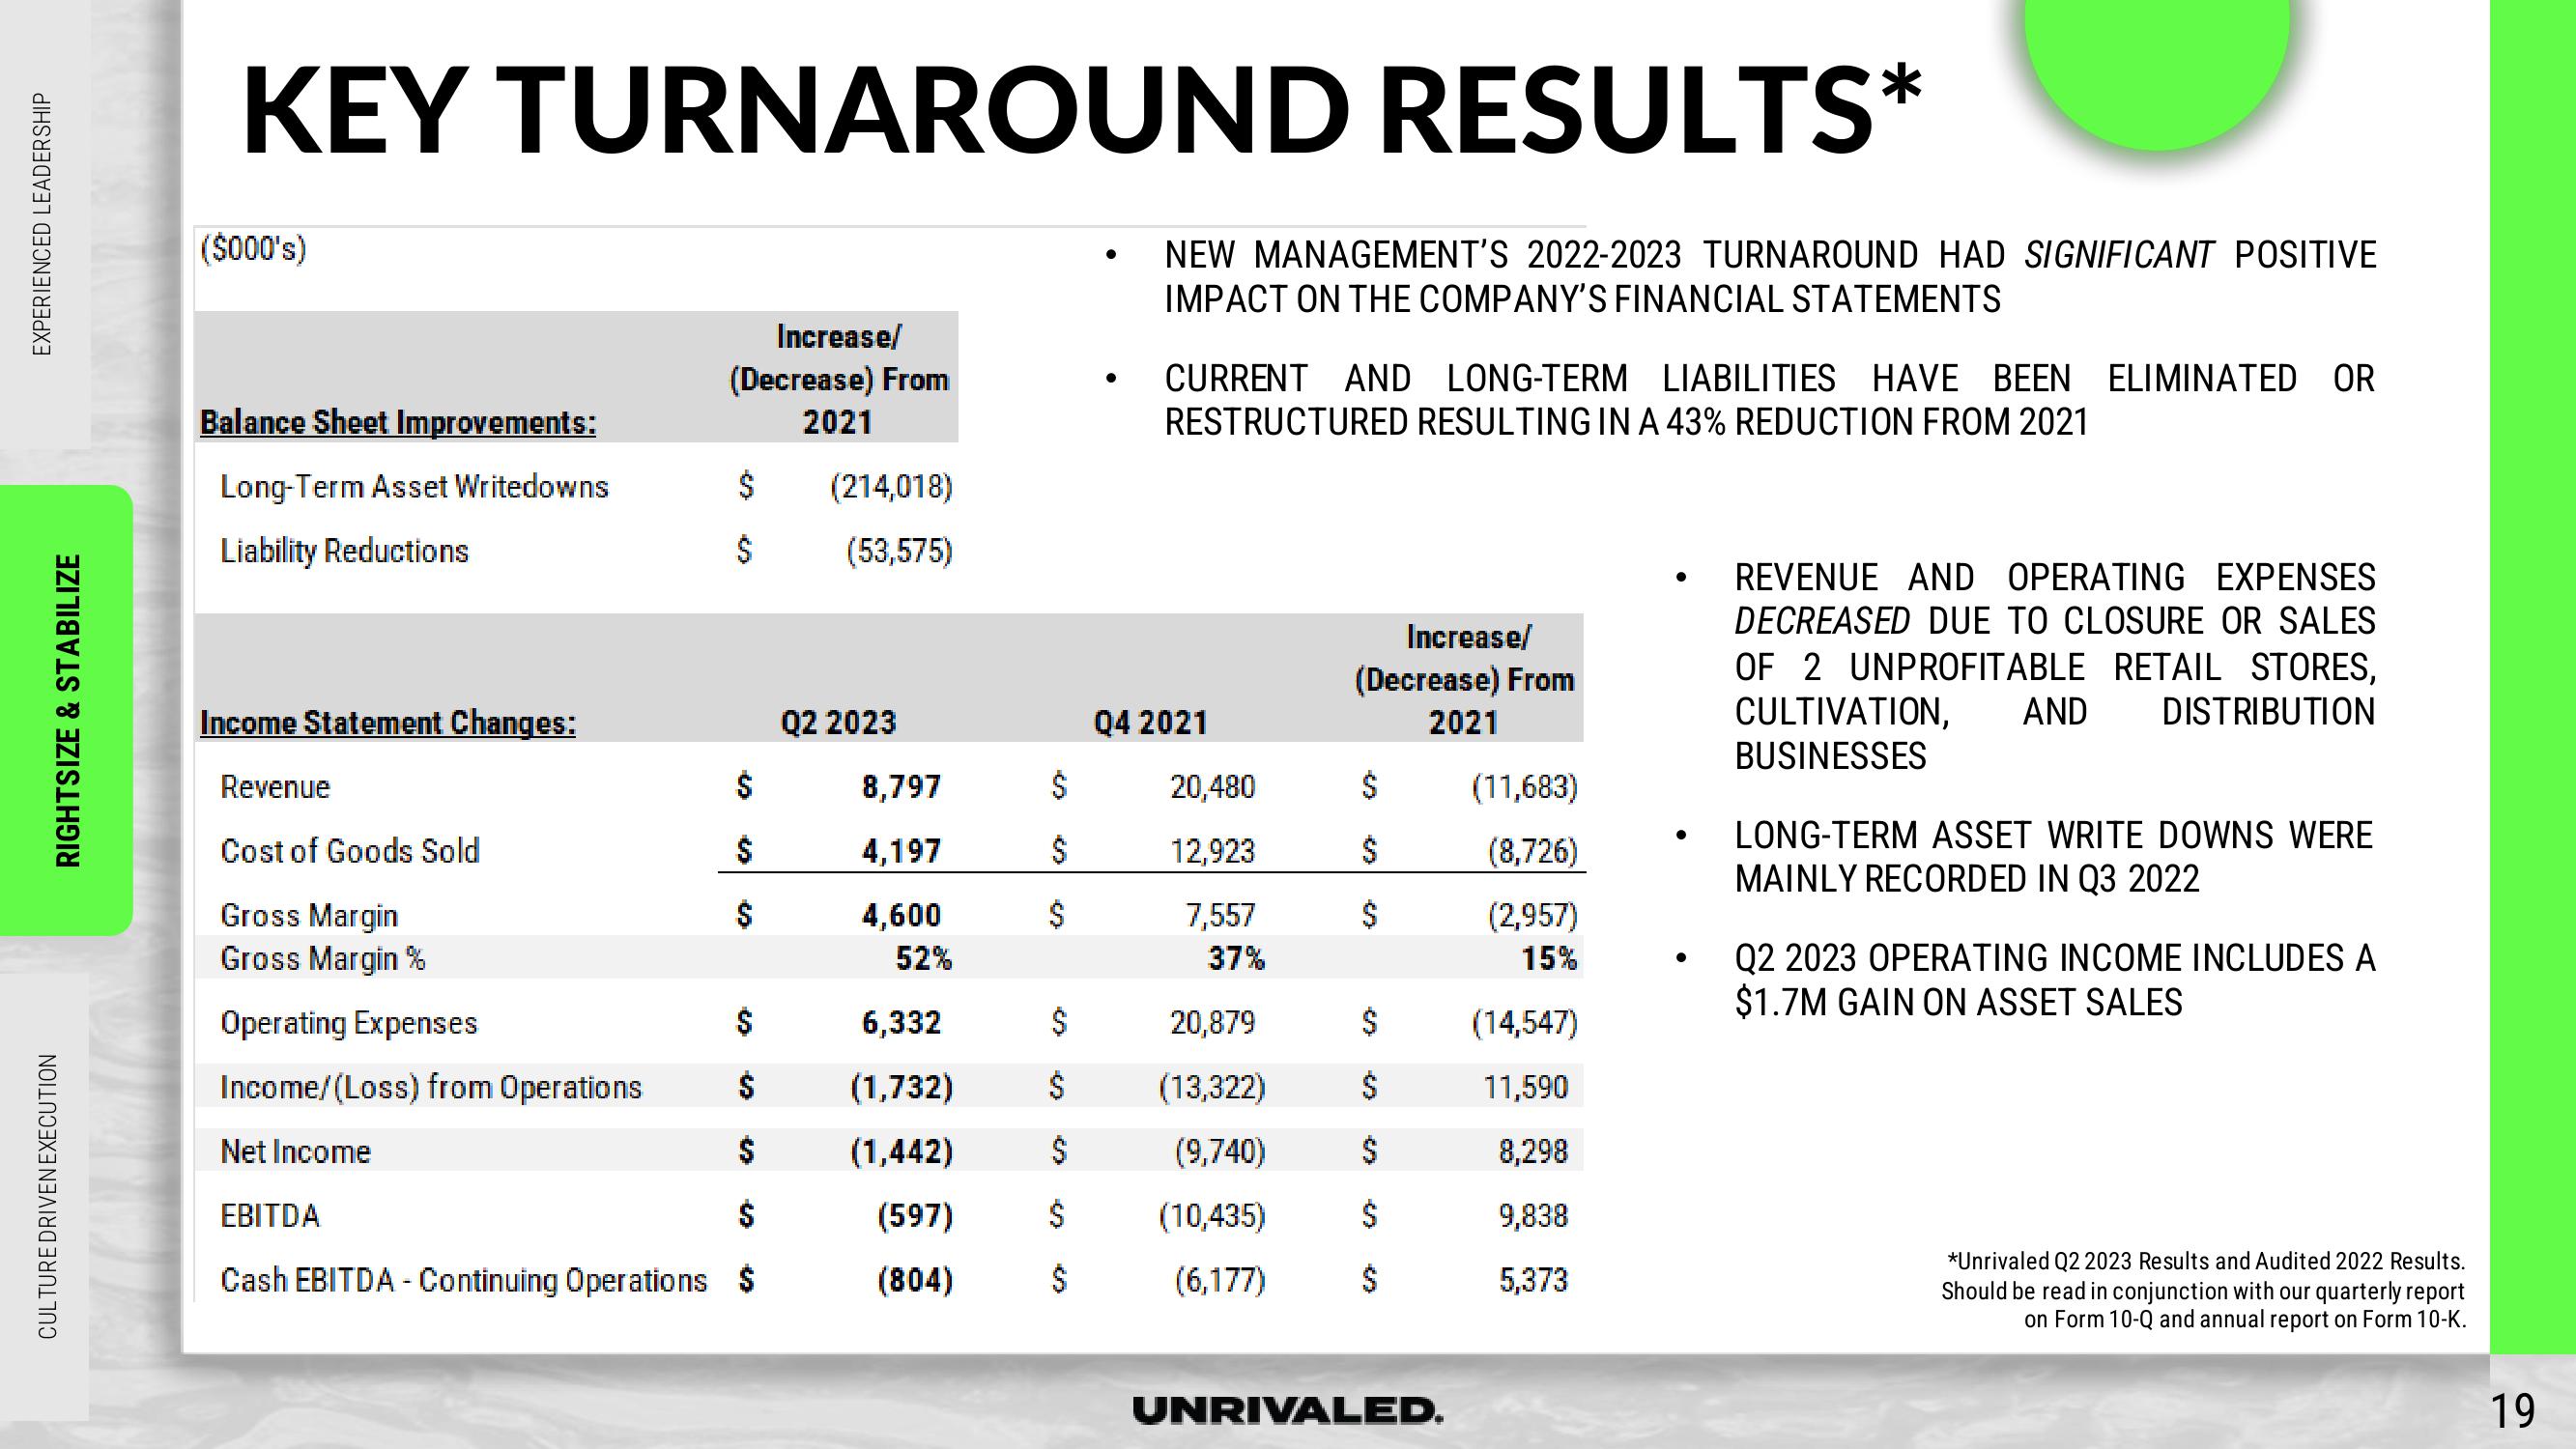
NEW MANAGEMENT'S 2022-2023 TURNAROUND HAD SIGNIFICANT POSITIVE
IMPACT ON THE COMPANY'S FINANCIAL STATEMENTS
CURRENT AND LONG-TERM LIABILITIES HAVE BEEN ELIMINATED OR
RESTRUCTURED RESULTING IN A 43% REDUCTION FROM 2021
Q4 2021
20,480
12,923
7,557
37%
20,879
(13,322)
(9,740)
(10,435)
(6,177)
Increase/
(Decrease) From
2021
$
$
UNRIVALED.
(11,683)
(8,726)
(2,957)
15%
(14,547)
11,590
8,298
9,838
5,373
●
REVENUE AND OPERATING EXPENSES
DECREASED DUE TO CLOSURE OR SALES
OF 2 UNPROFITABLE RETAIL STORES,
CULTIVATION, AND DISTRIBUTION
BUSINESSES
LONG-TERM ASSET WRITE DOWNS WERE
MAINLY RECORDED IN Q3 2022
Q2 2023 OPERATING INCOME INCLUDES A
$1.7M GAIN ON ASSET SALES
*Unrivaled Q2 2023 Results and Audited 2022 Results.
Should be read in conjunction with our quarterly report
on Form 10-Q and annual report on Form 10-K.
19View entire presentation