Verint SPAC Presentation Deck
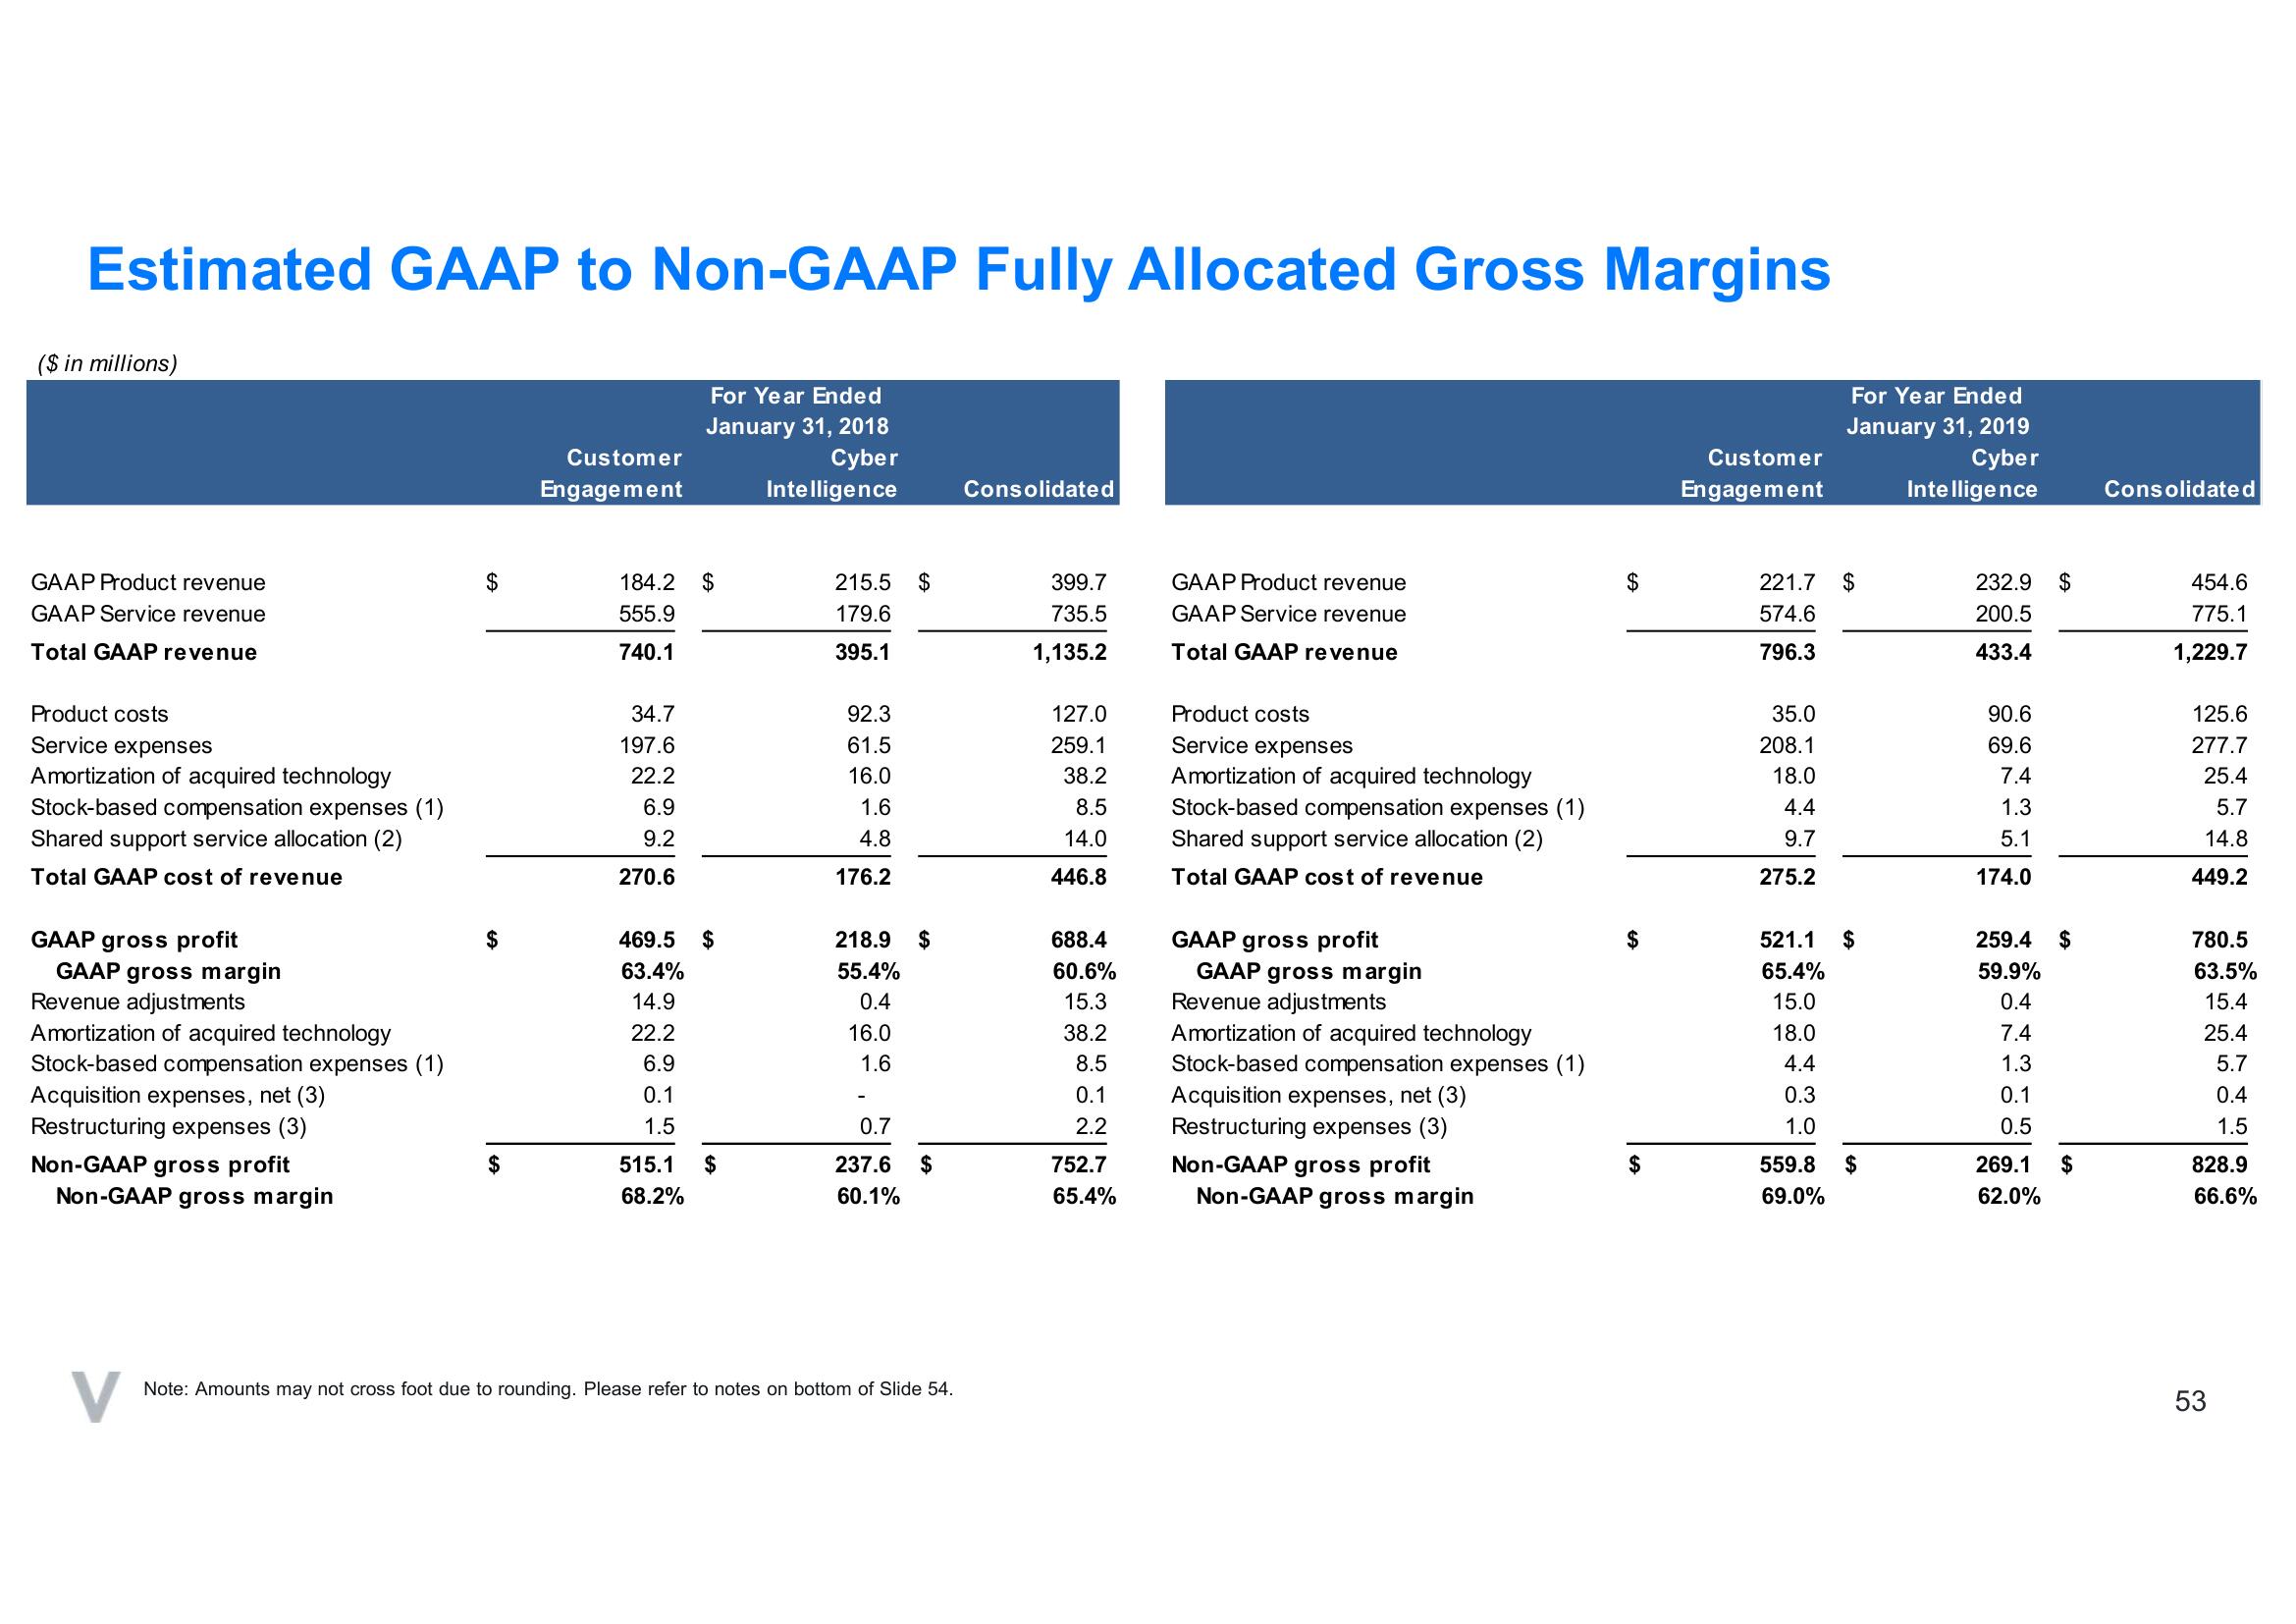
Estimated GAAP to Non-GAAP Fully Allocated Gross Margins
For Year Ended
January 31, 2018
Cyber
Intelligence
($ in millions)
GAAP Product revenue
GAAP Service revenue
Total GAAP revenue
Product costs
Service expenses
Amortization of acquired technology
Stock-based compensation expenses (1)
Shared support service allocation (2)
Total GAAP cost of revenue
GAAP gross profit
GAAP gross margin
Revenue adjustments
Amortization of acquired technology
Stock-based compensation expenses (1)
Acquisition expenses, net (3)
Restructuring expenses (3)
Non-GAAP gross profit
Non-GAAP gross margin
$
$
Customer
Engagement
184.2 $
555.9
740.1
34.7
197.6
22.2
6.9
9.2
270.6
469.5 $
63.4%
14.9
22.2
6.9
0.1
1.5
515.1
68.2%
$
215.5 $
179.6
395.1
92.3
61.5
16.0
1.6
4.8
176.2
218.9
55.4%
0.4
16.0
1.6
-
0.7
237.6
60.1%
$
$
Note: Amounts may not cross foot due to rounding. Please refer to notes on bottom of Slide 54.
Consolidated
399.7
735.5
1,135.2
127.0
259.1
38.2
8.5
14.0
446.8
688.4
60.6%
15.3
38.2
8.5
0.1
2.2
752.7
65.4%
GAAP Product revenue
GAAP Service revenue
Total GAAP revenue
Product costs
Service expenses
Amortization of acquired technology
Stock-based compensation expenses (1)
Shared support service allocation (2)
Total GAAP cost of revenue
GAAP gross profit
GAAP gross margin
Revenue adjustments
Amortization of acquired technology
Stock-based compensation expenses (1)
Acquisition expenses, net (3)
Restructuring expenses (3)
Non-GAAP gross profit
Non-GAAP gross margin
$
$
$
Customer
Engagement
221.7 $
574.6
796.3
35.0
208.1
18.0
4.4
9.7
275.2
For Year Ended
January 31, 2019
Cyber
Intelligence
521.1
65.4%
15.0
18.0
4.4
0.3
1.0
559.8
69.0%
$
$
232.9 $
200.5
433.4
90.6
69.6
7.4
1.3
5.1
174.0
259.4 $
59.9%
0.4
7.4
1.3
0.1
0.5
269.1
62.0%
$
Consolidated
454.6
775.1
1,229.7
125.6
277.7
25.4
5.7
14.8
449.2
780.5
63.5%
15.4
25.4
5.7
0.4
1.5
828.9
66.6%
53View entire presentation