AvePoint Investor Presentation Deck
22
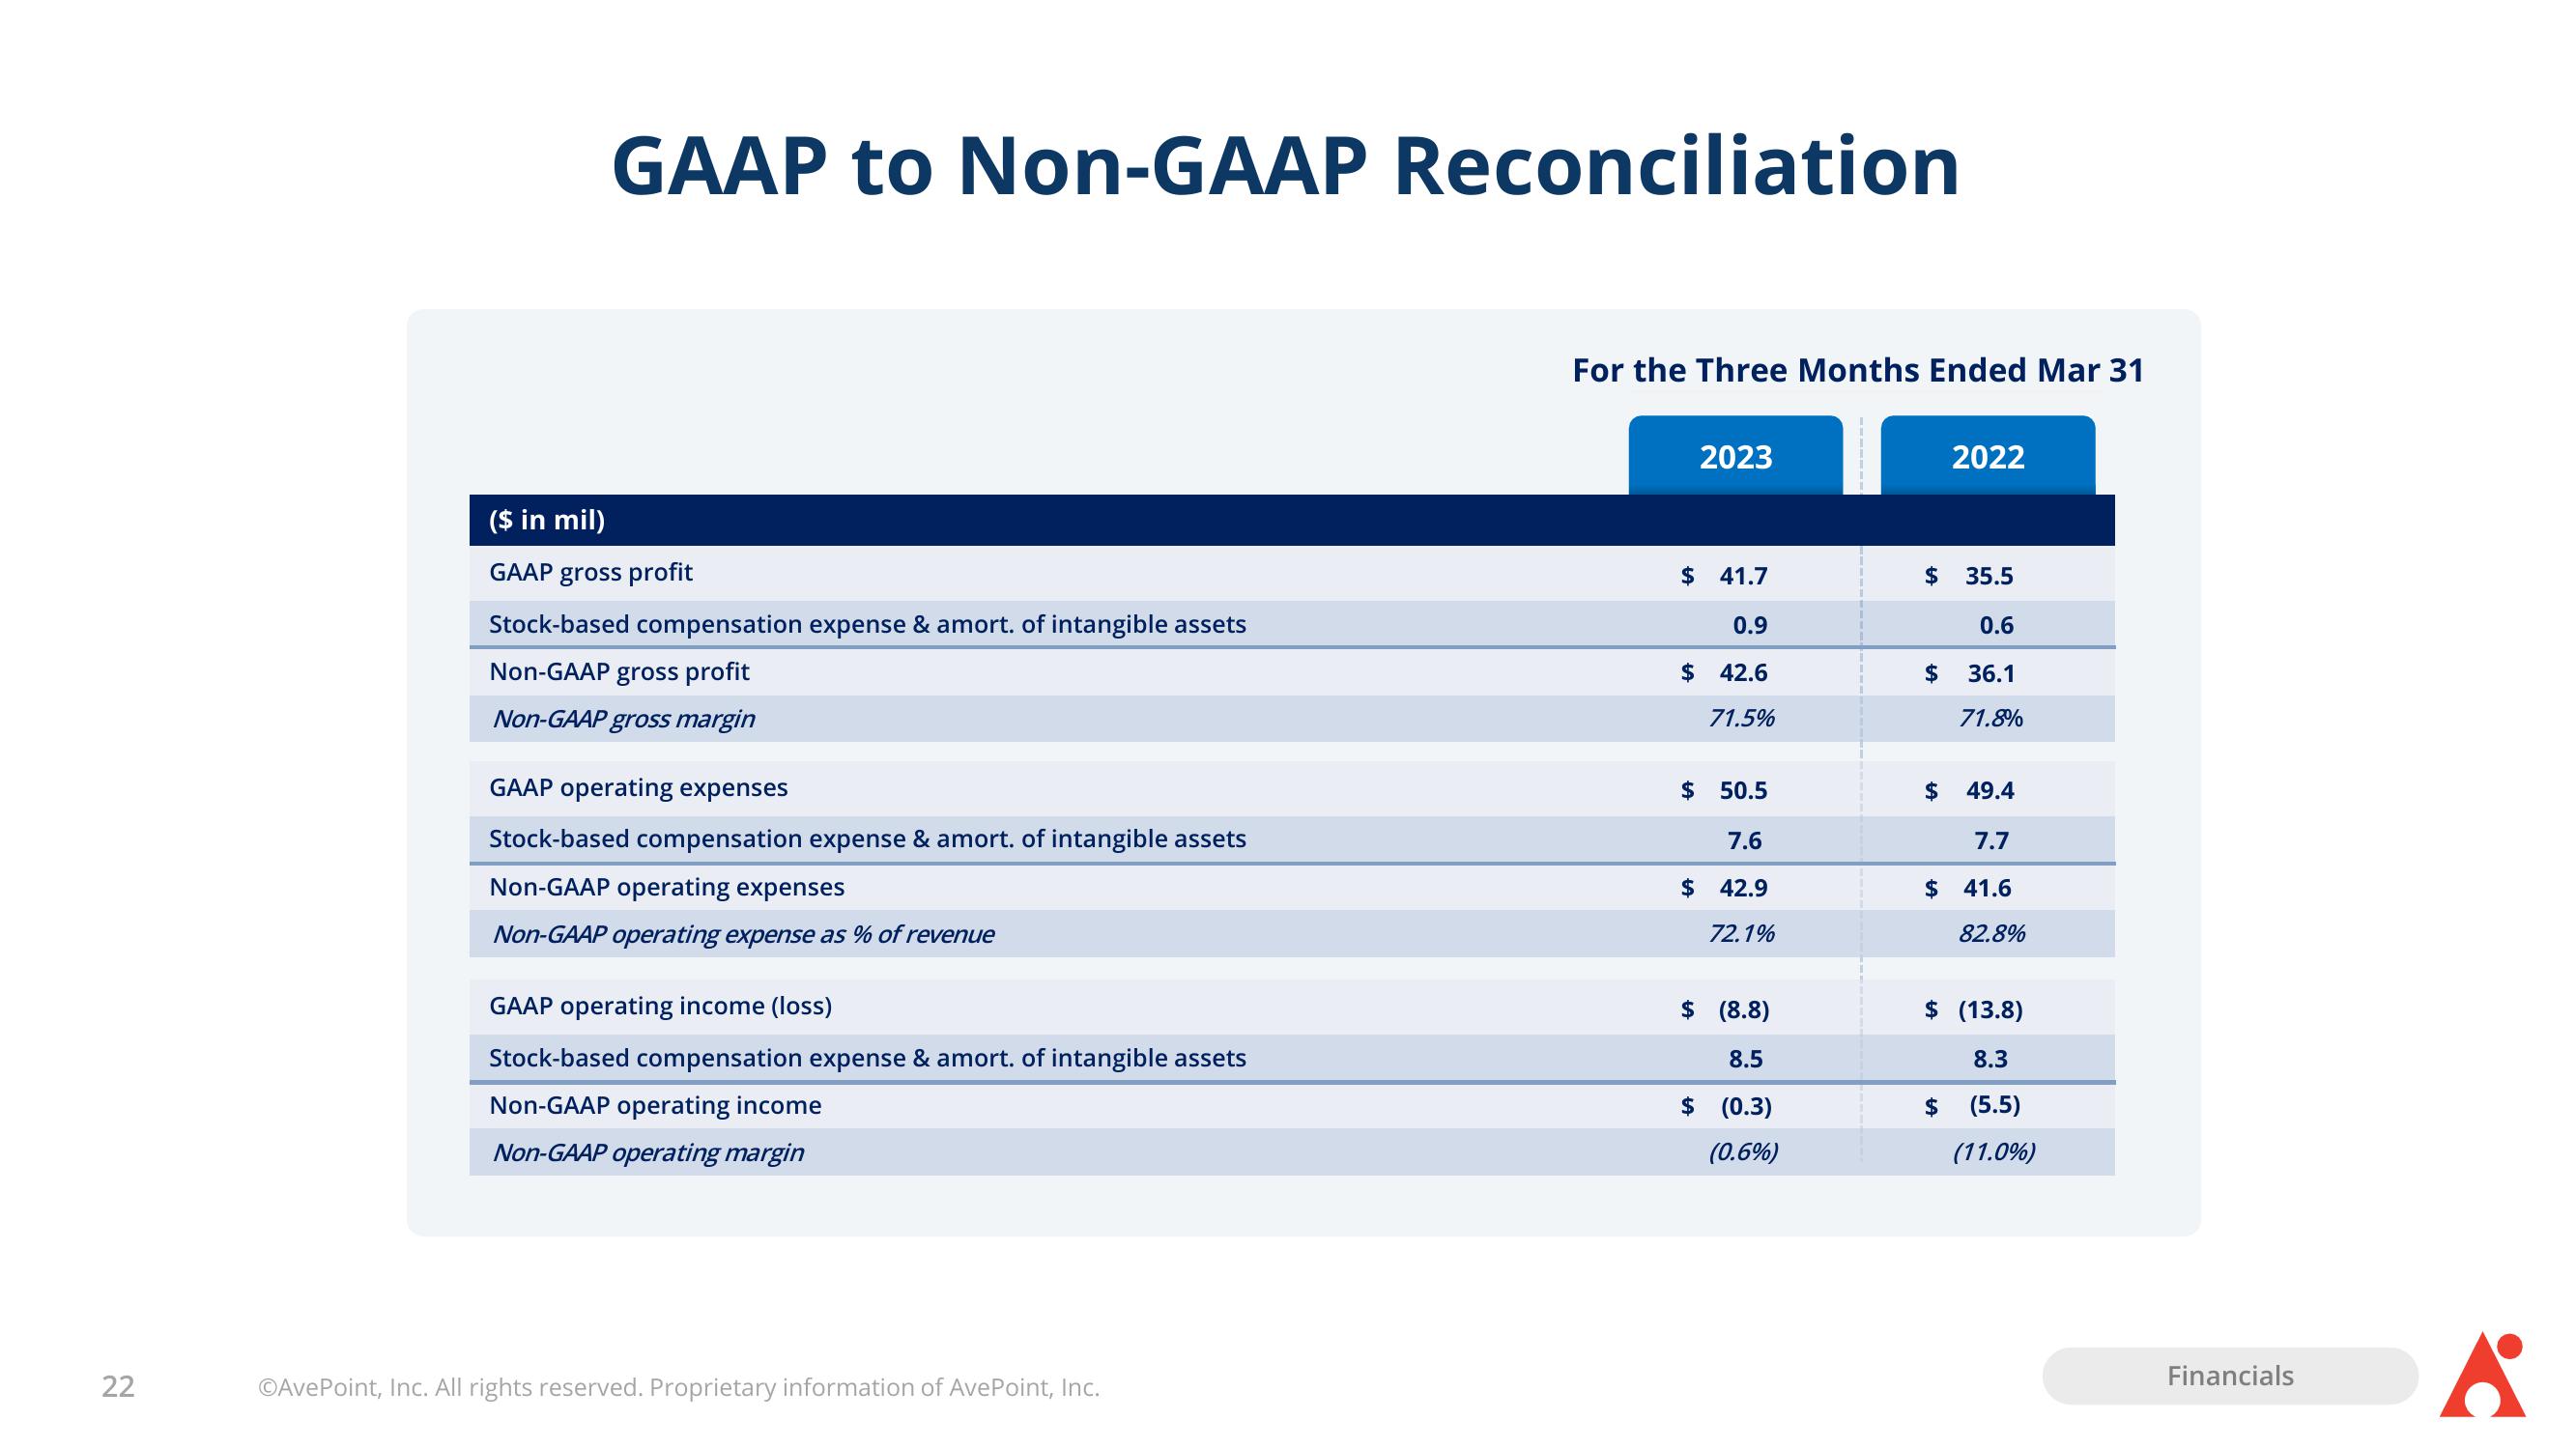
GAAP to Non-GAAP Reconciliation
($ in mil)
GAAP gross profit
Stock-based compensation expense & amort. of intangible assets
Non-GAAP gross profit
Non-GAAP gross margin
GAAP operating expenses
Stock-based compensation expense & amort. of intangible assets
Non-GAAP operating expenses
Non-GAAP operating expense as % of revenue
GAAP operating income (loss)
Stock-based compensation expense & amort. of intangible assets
Non-GAAP operating income
Non-GAAP operating margin
©AvePoint, Inc. All rights reserved. Proprietary information of AvePoint, Inc.
For the Three Months Ended Mar 31
2023
$ 41.7
0.9
$ 42.6
71.5%
$ 50.5
7.6
$42.9
72.1%
$ (8.8)
8.5
$ (0.3)
(0.6%)
$ 35.5
0.6
36.1
71.8%
$
$
2022
49.4
7.7
$ 41.6
82.8%
$ (13.8)
$
8.3
(5.5)
(11.0%)
Financials
6View entire presentation