Topps SPAC Presentation Deck
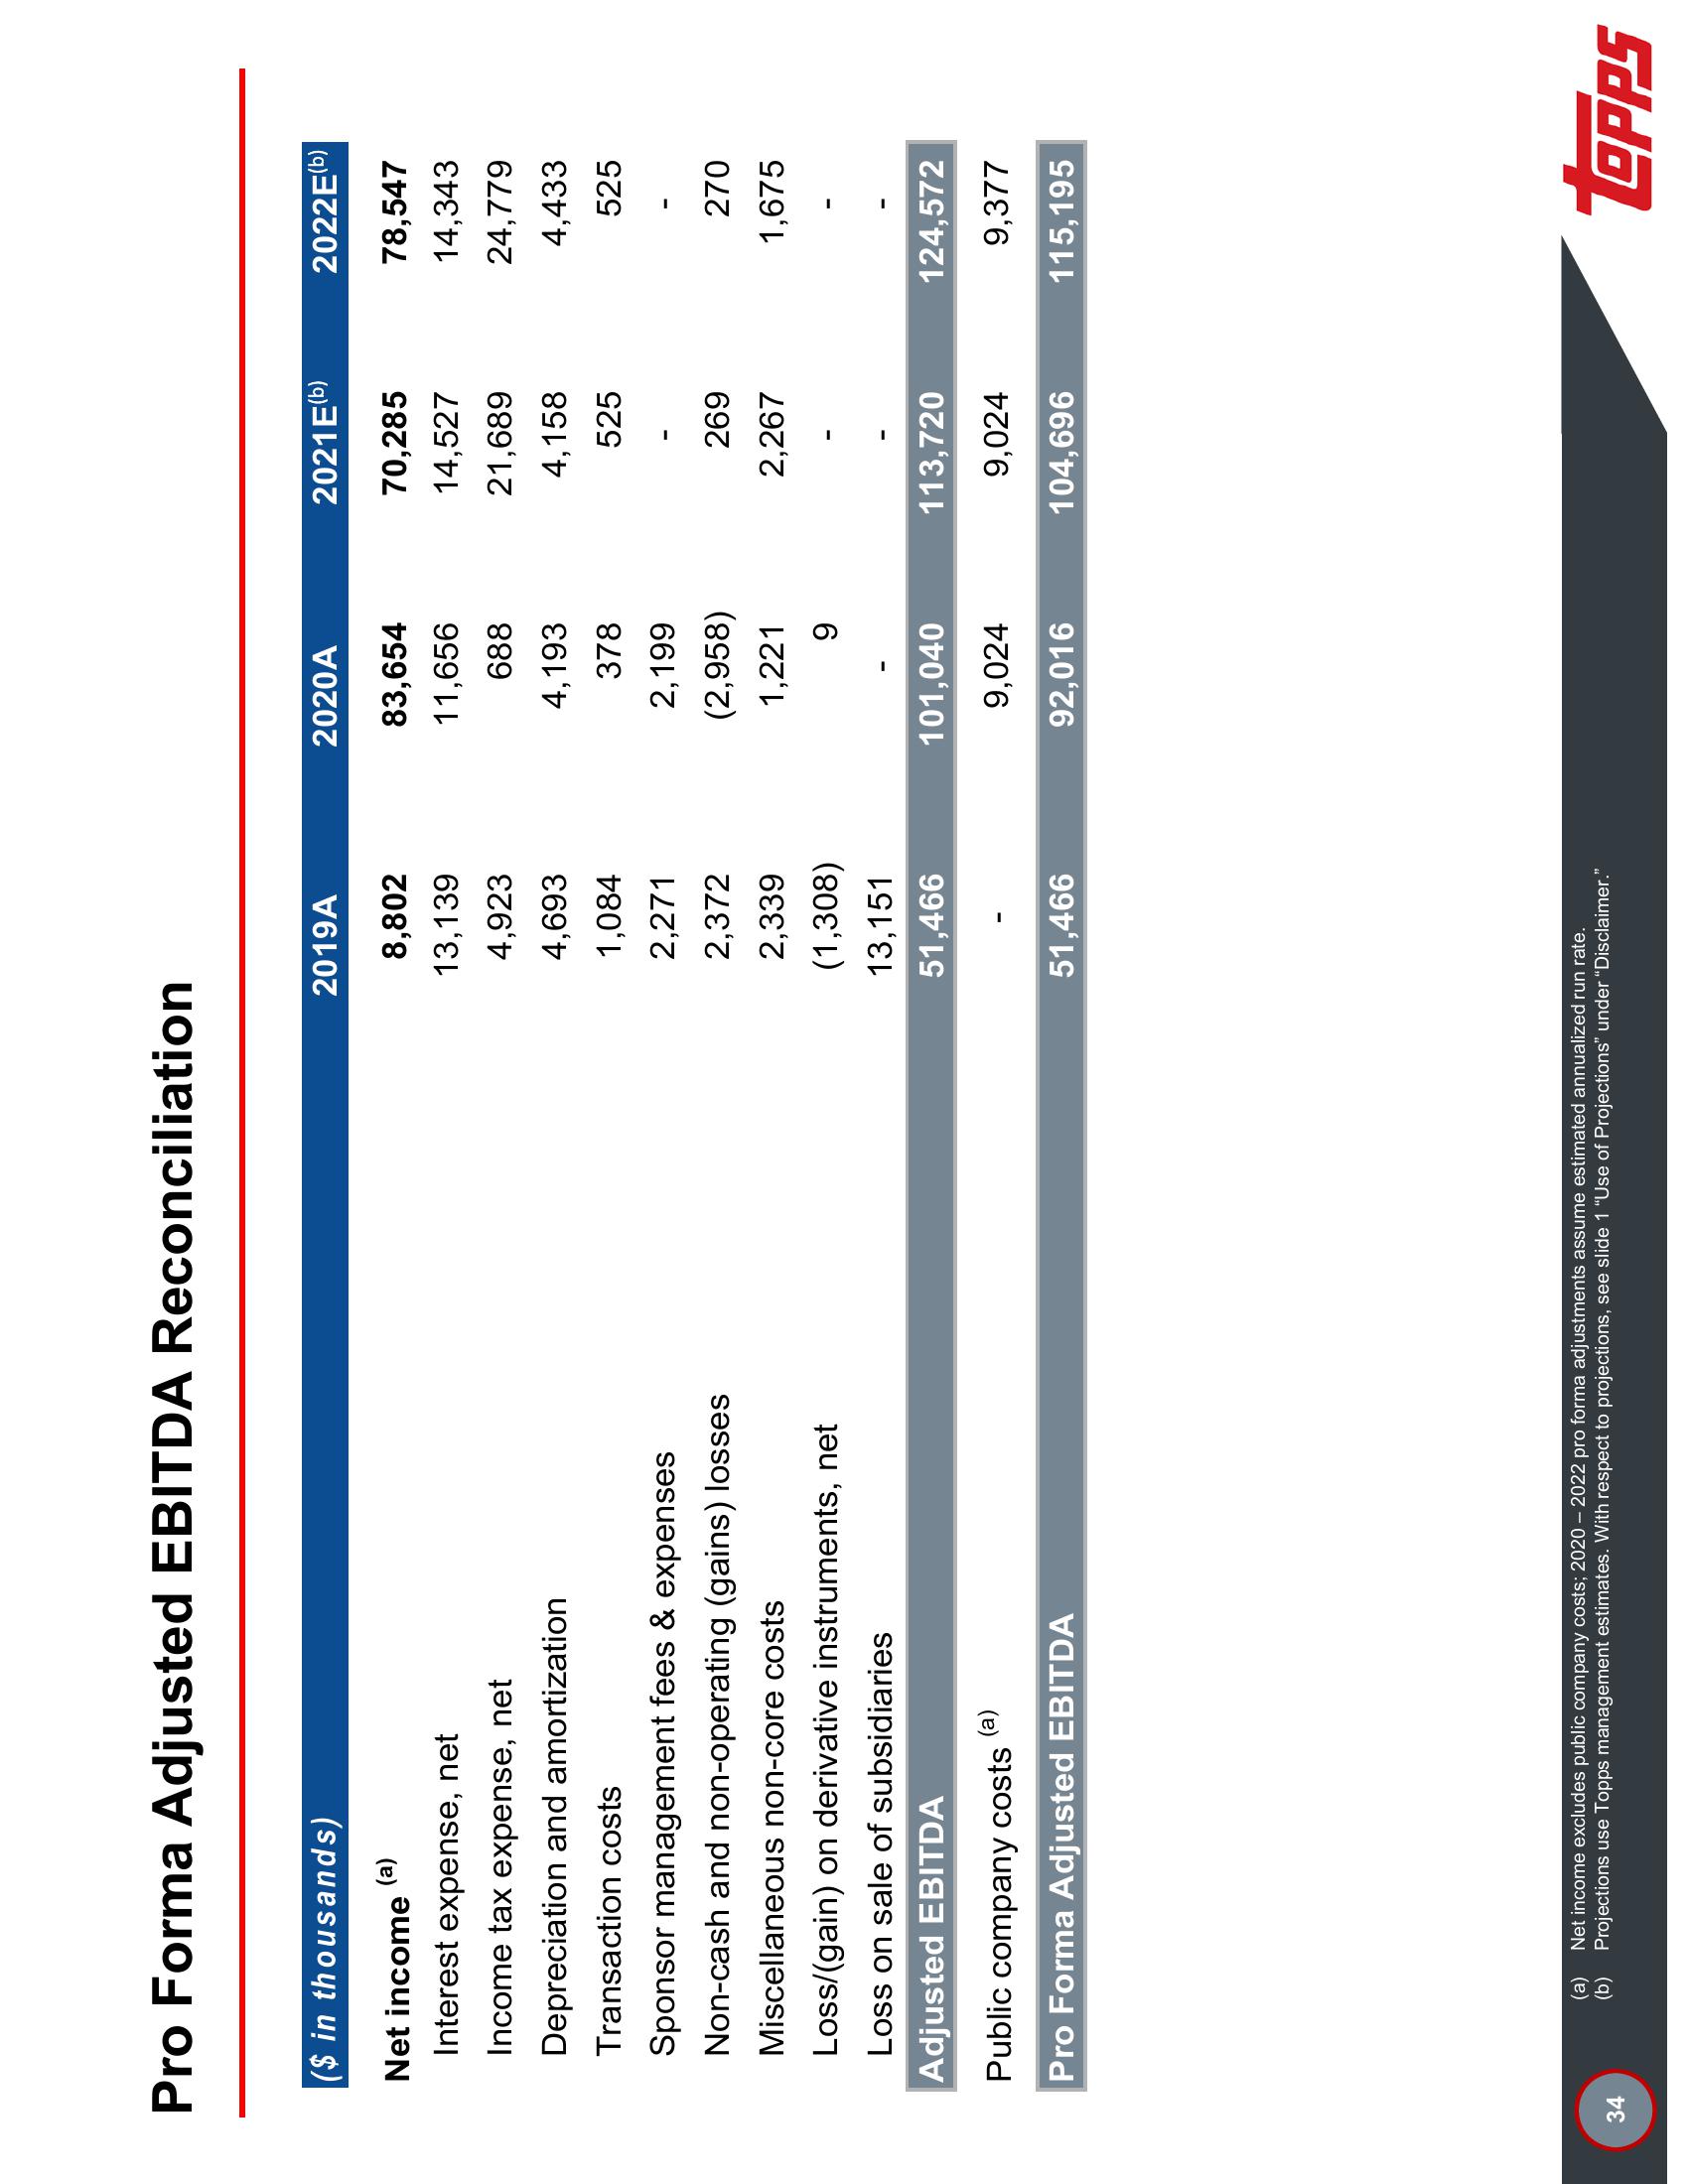
Pro Forma Adjusted EBITDA Reconciliation
34
($ in thousands)
(a)
Net income
Interest expense, net
Income tax expense, net
Depreciation and amortization
Transaction costs
Sponsor management fees & expenses
Non-cash and non-operating (gains) losses
Miscellaneous non-core costs
Loss/(gain) on derivative instruments, net
Loss on sale of subsidiaries
Adjusted EBITDA
(a)
Public company costs
Pro Forma Adjusted EBITDA
2019A
8,802
13,139
4,923
4,693
1,084
2,271
2,372
2,339
(1,308)
13,151
51,466
51,466
(a) Net income excludes public company costs; 2020-2022 pro forma adjustments assume estimated annualized run rate.
(b) Projections use Topps management estimates. With respect to projections, see slide 1 "Use of Projections" under "Disclaimer."
2020A
83,654
11,656
688
4,193
378
2,199
(2,958)
1,221
9
101,040
9,024
92,016
2021E(b)
70,285
14,527
21,689
4,158
525
269
2,267
113,720
9,024
104,696
2022E(b)
78,547
14,343
24,779
4,433
525
270
1,675
124,572
9,377
115,195
LOPPSView entire presentation