FiscalNote SPAC Presentation Deck
38
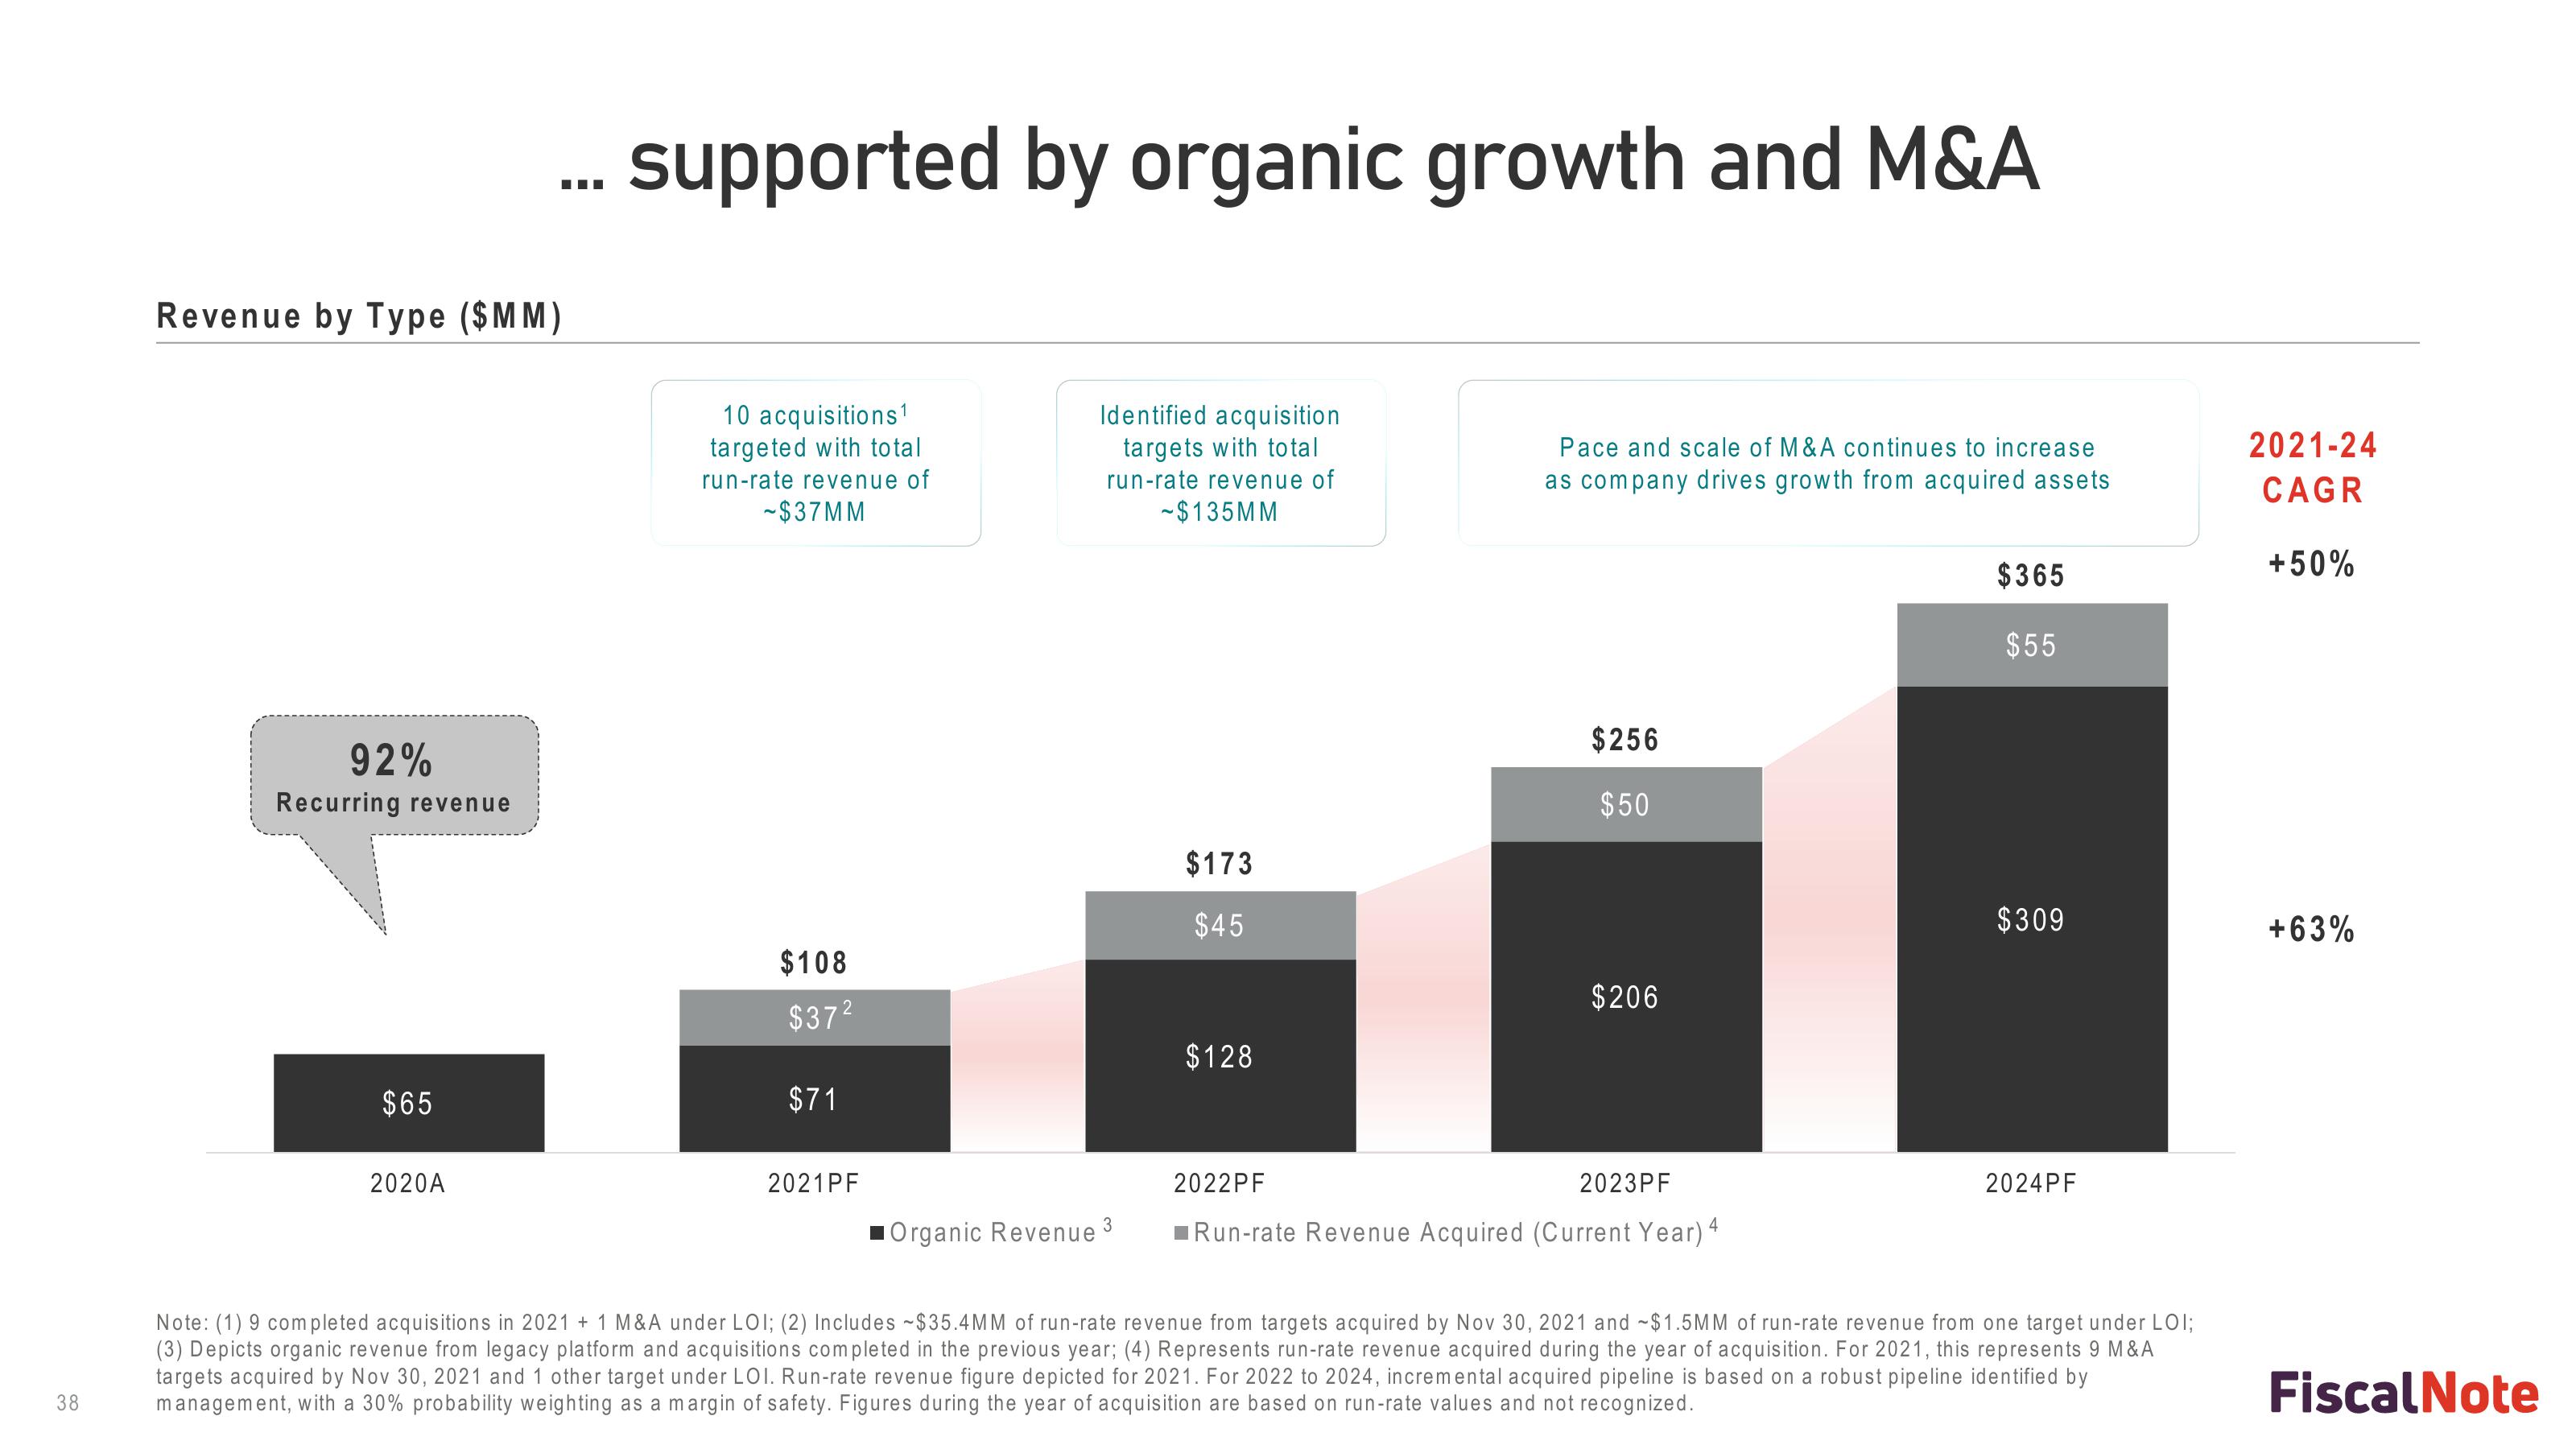
Revenue by Type ($MM)
92%
Recurring revenue
$65
2020A
supported by organic growth and M&A
10 acquisitions1
targeted with total
run-rate revenue of
-~$37MM
$108
$37²
$71
2021PF
Identified acquisition
targets with total
run-rate revenue of
-$135MM
Organic Revenue 3
$173
$45
$128
Pace and scale of M&A continues to increase
as company drives growth from acquired assets
$256
$50
$206
2022PF
■Run-rate Revenue Acquired (Current Year) 4
2023PF
$365
$55
$309
2024PF
Note: (1) 9 completed acquisitions in 2021 + 1 M&A under LOI; (2) Includes ~$35.4MM of run-rate revenue from targets acquired by Nov 30, 2021 and ~$1.5MM of run-rate revenue from one target under LOI;
(3) Depicts organic revenue from legacy platform and acquisitions completed in the previous year; (4) Represents run-rate revenue acquired during the year of acquisition. For 2021, this represents 9 M&A
targets acquired by Nov 30, 2021 and 1 other target under LOI. Run-rate revenue figure depicted for 2021. For 2022 to 2024, incremental acquired pipeline is based on a robust pipeline identified by
management, with a 30% probability weighting as a margin of safety. Figures during the year of acquisition are based on run-rate values and not recognized.
2021-24
CAGR
+50%
+63%
Fiscal NoteView entire presentation