Mondi Mergers and Acquisitions Presentation Deck
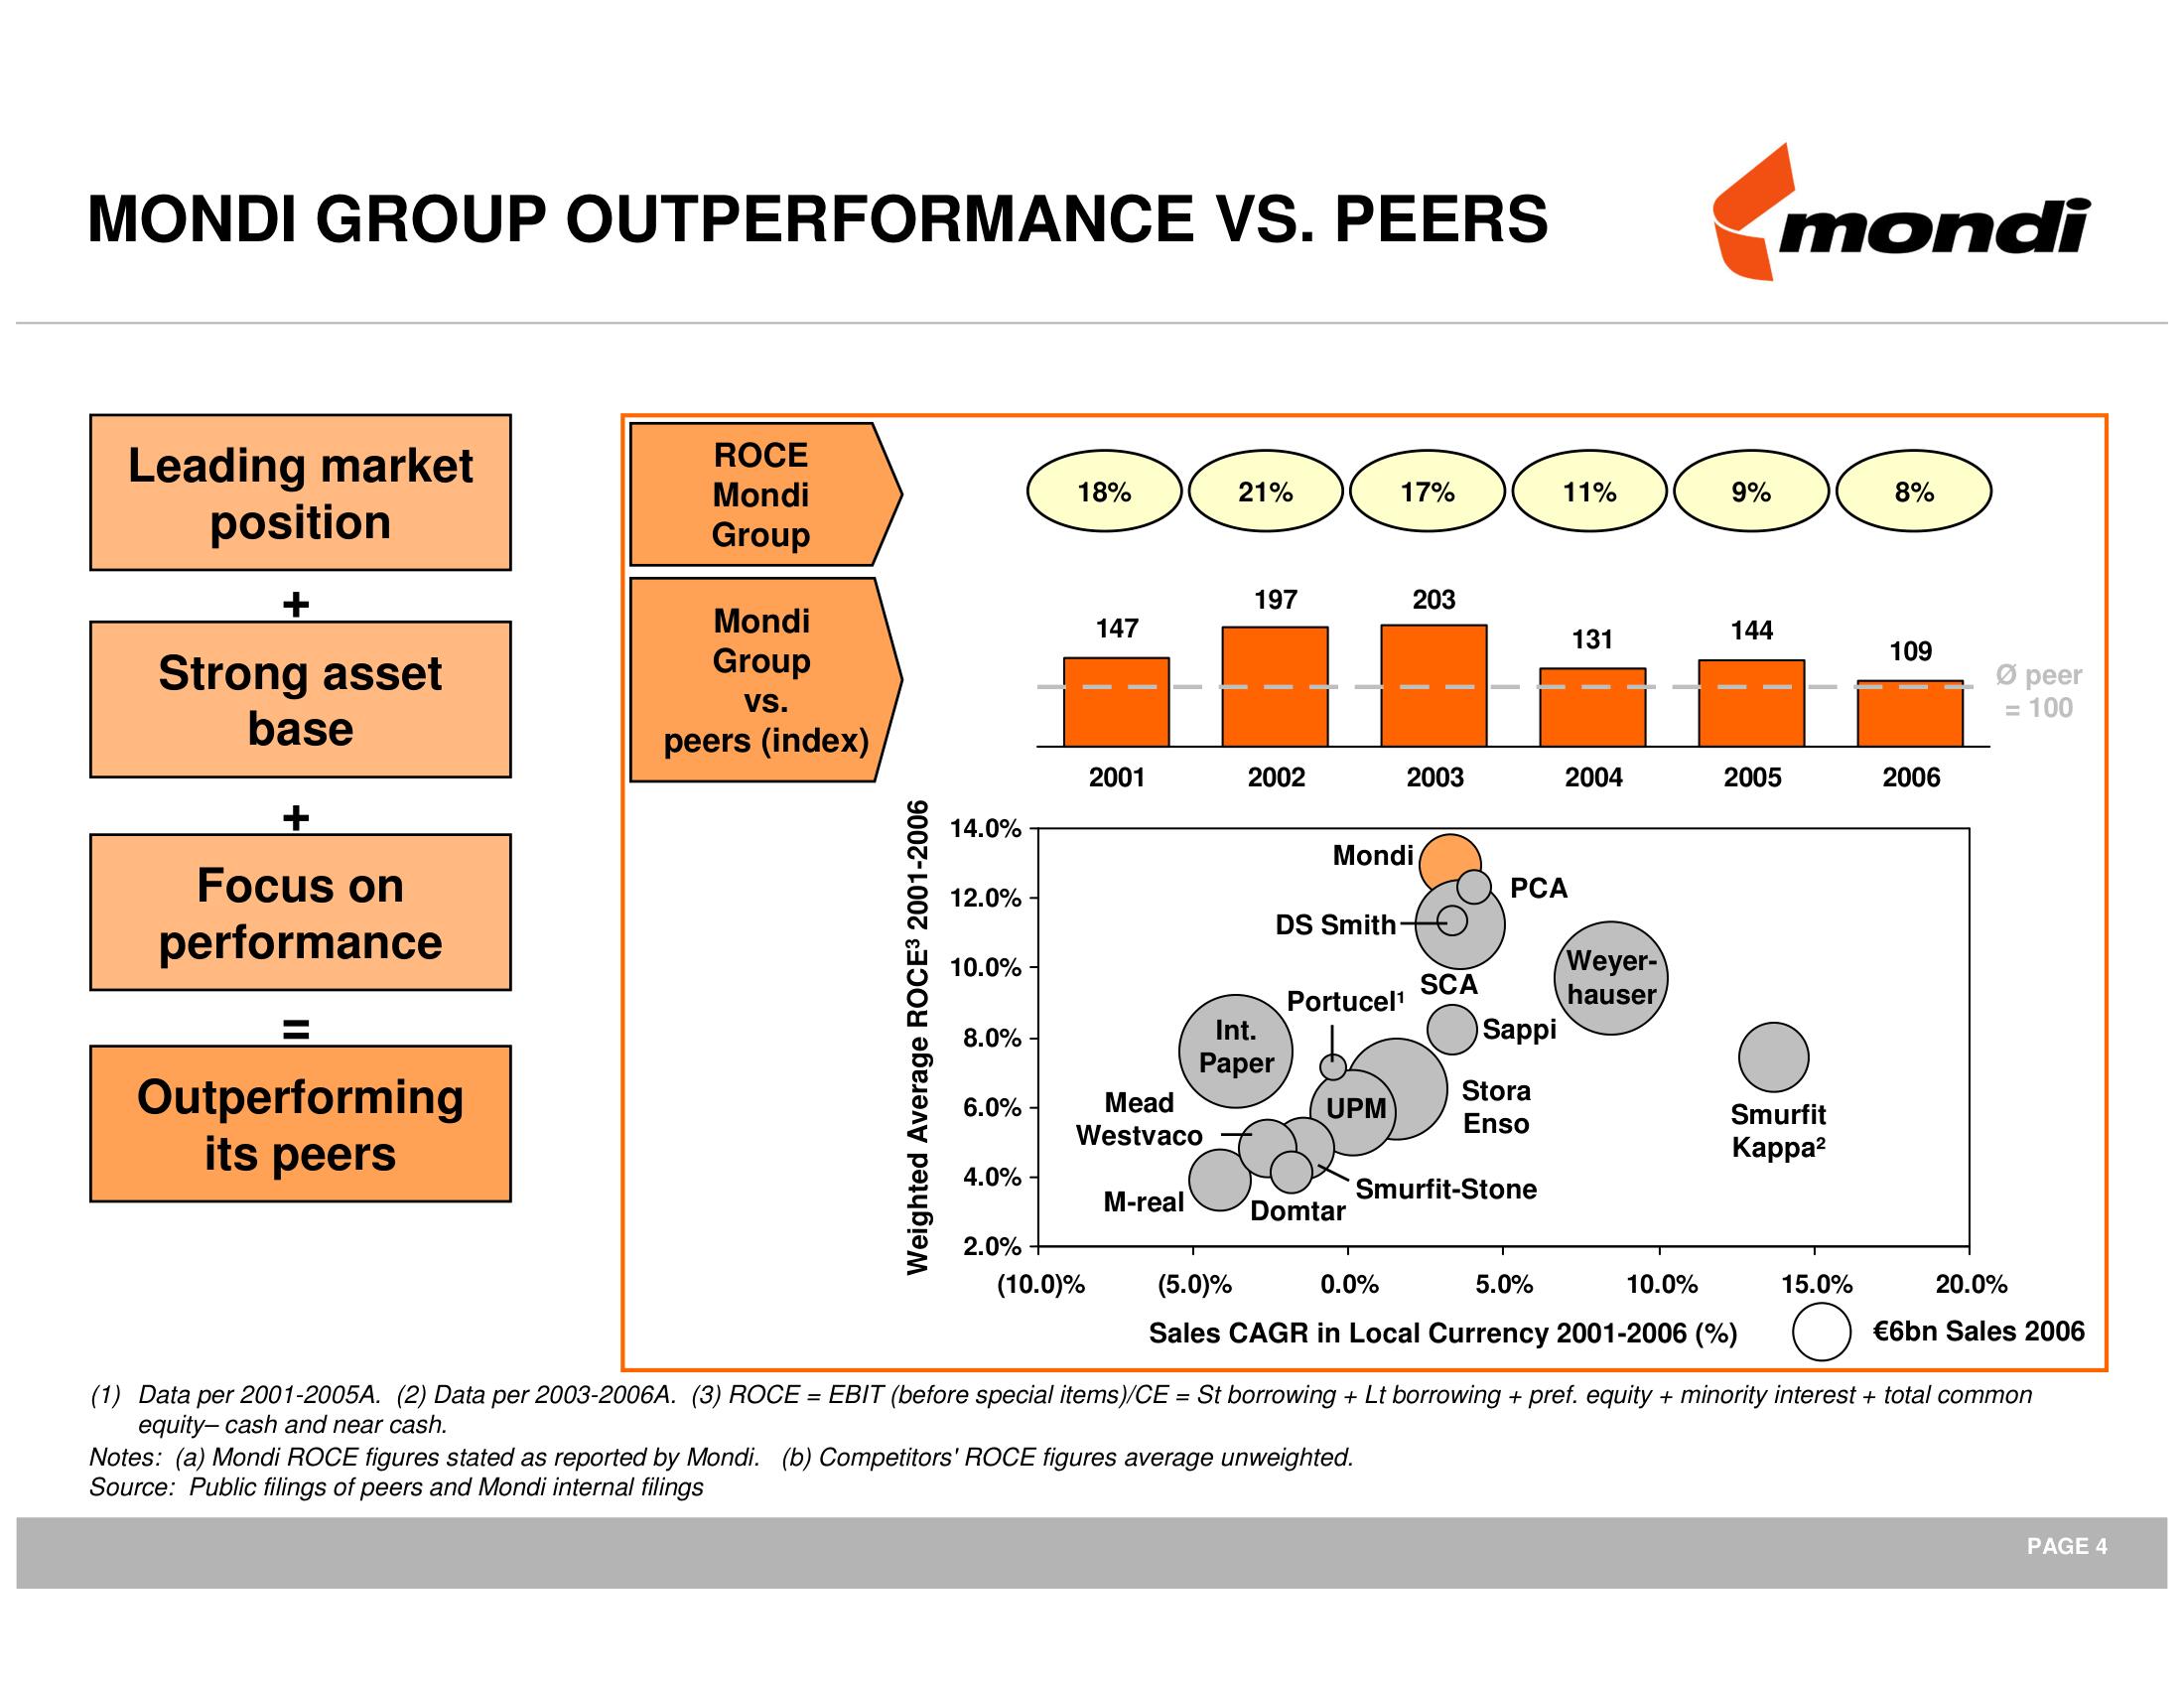
MONDI GROUP OUTPERFORMANCE VS. PEERS
Leading market
position
+
Strong asset
base
Focus on
performance
Outperforming
its peers
ROCE
Mondi
Group
Mondi
Group
VS.
peers (index)
Weighted Average ROCE³ 2001-2006
14.0%
12.0%
10.0%
8.0%
6.0%
4.0%
2.0%
18%
147
(10.0)%
2001
Mead
Westvaco
M-real
21%
197
2002
Int.
Paper
DS Smith-
17%
Mondi
Portucel¹
UPM
Domtar
203
2003
Notes: (a) Mondi ROCE figures stated as reported by Mondi. (b) Competitors' ROCE figures average unweighted.
Source: Public filings of peers and Mondi internal filings
SCA
Sappi
PCA
Stora
Enso
11%
Smurfit-Stone
131
2004
Weyer-
hauser
9%
10.0%
144
5.0%
(5.0)%
0.0%
Sales CAGR in Local Currency 2001-2006 (%)
mondi
2005
Smurfit
Kappa²
15.0%
8%
109
2006
Ø peer
100
20.0%
€6bn Sales 2006
(1) Data per 2001-2005A. (2) Data per 2003-2006A. (3) ROCE = EBIT (before special items)/CE = St borrowing + Lt borrowing + pref. equity + minority interest + total common
equity-cash and near cash.
PAGE 4View entire presentation