WPP ESG Presentation Deck
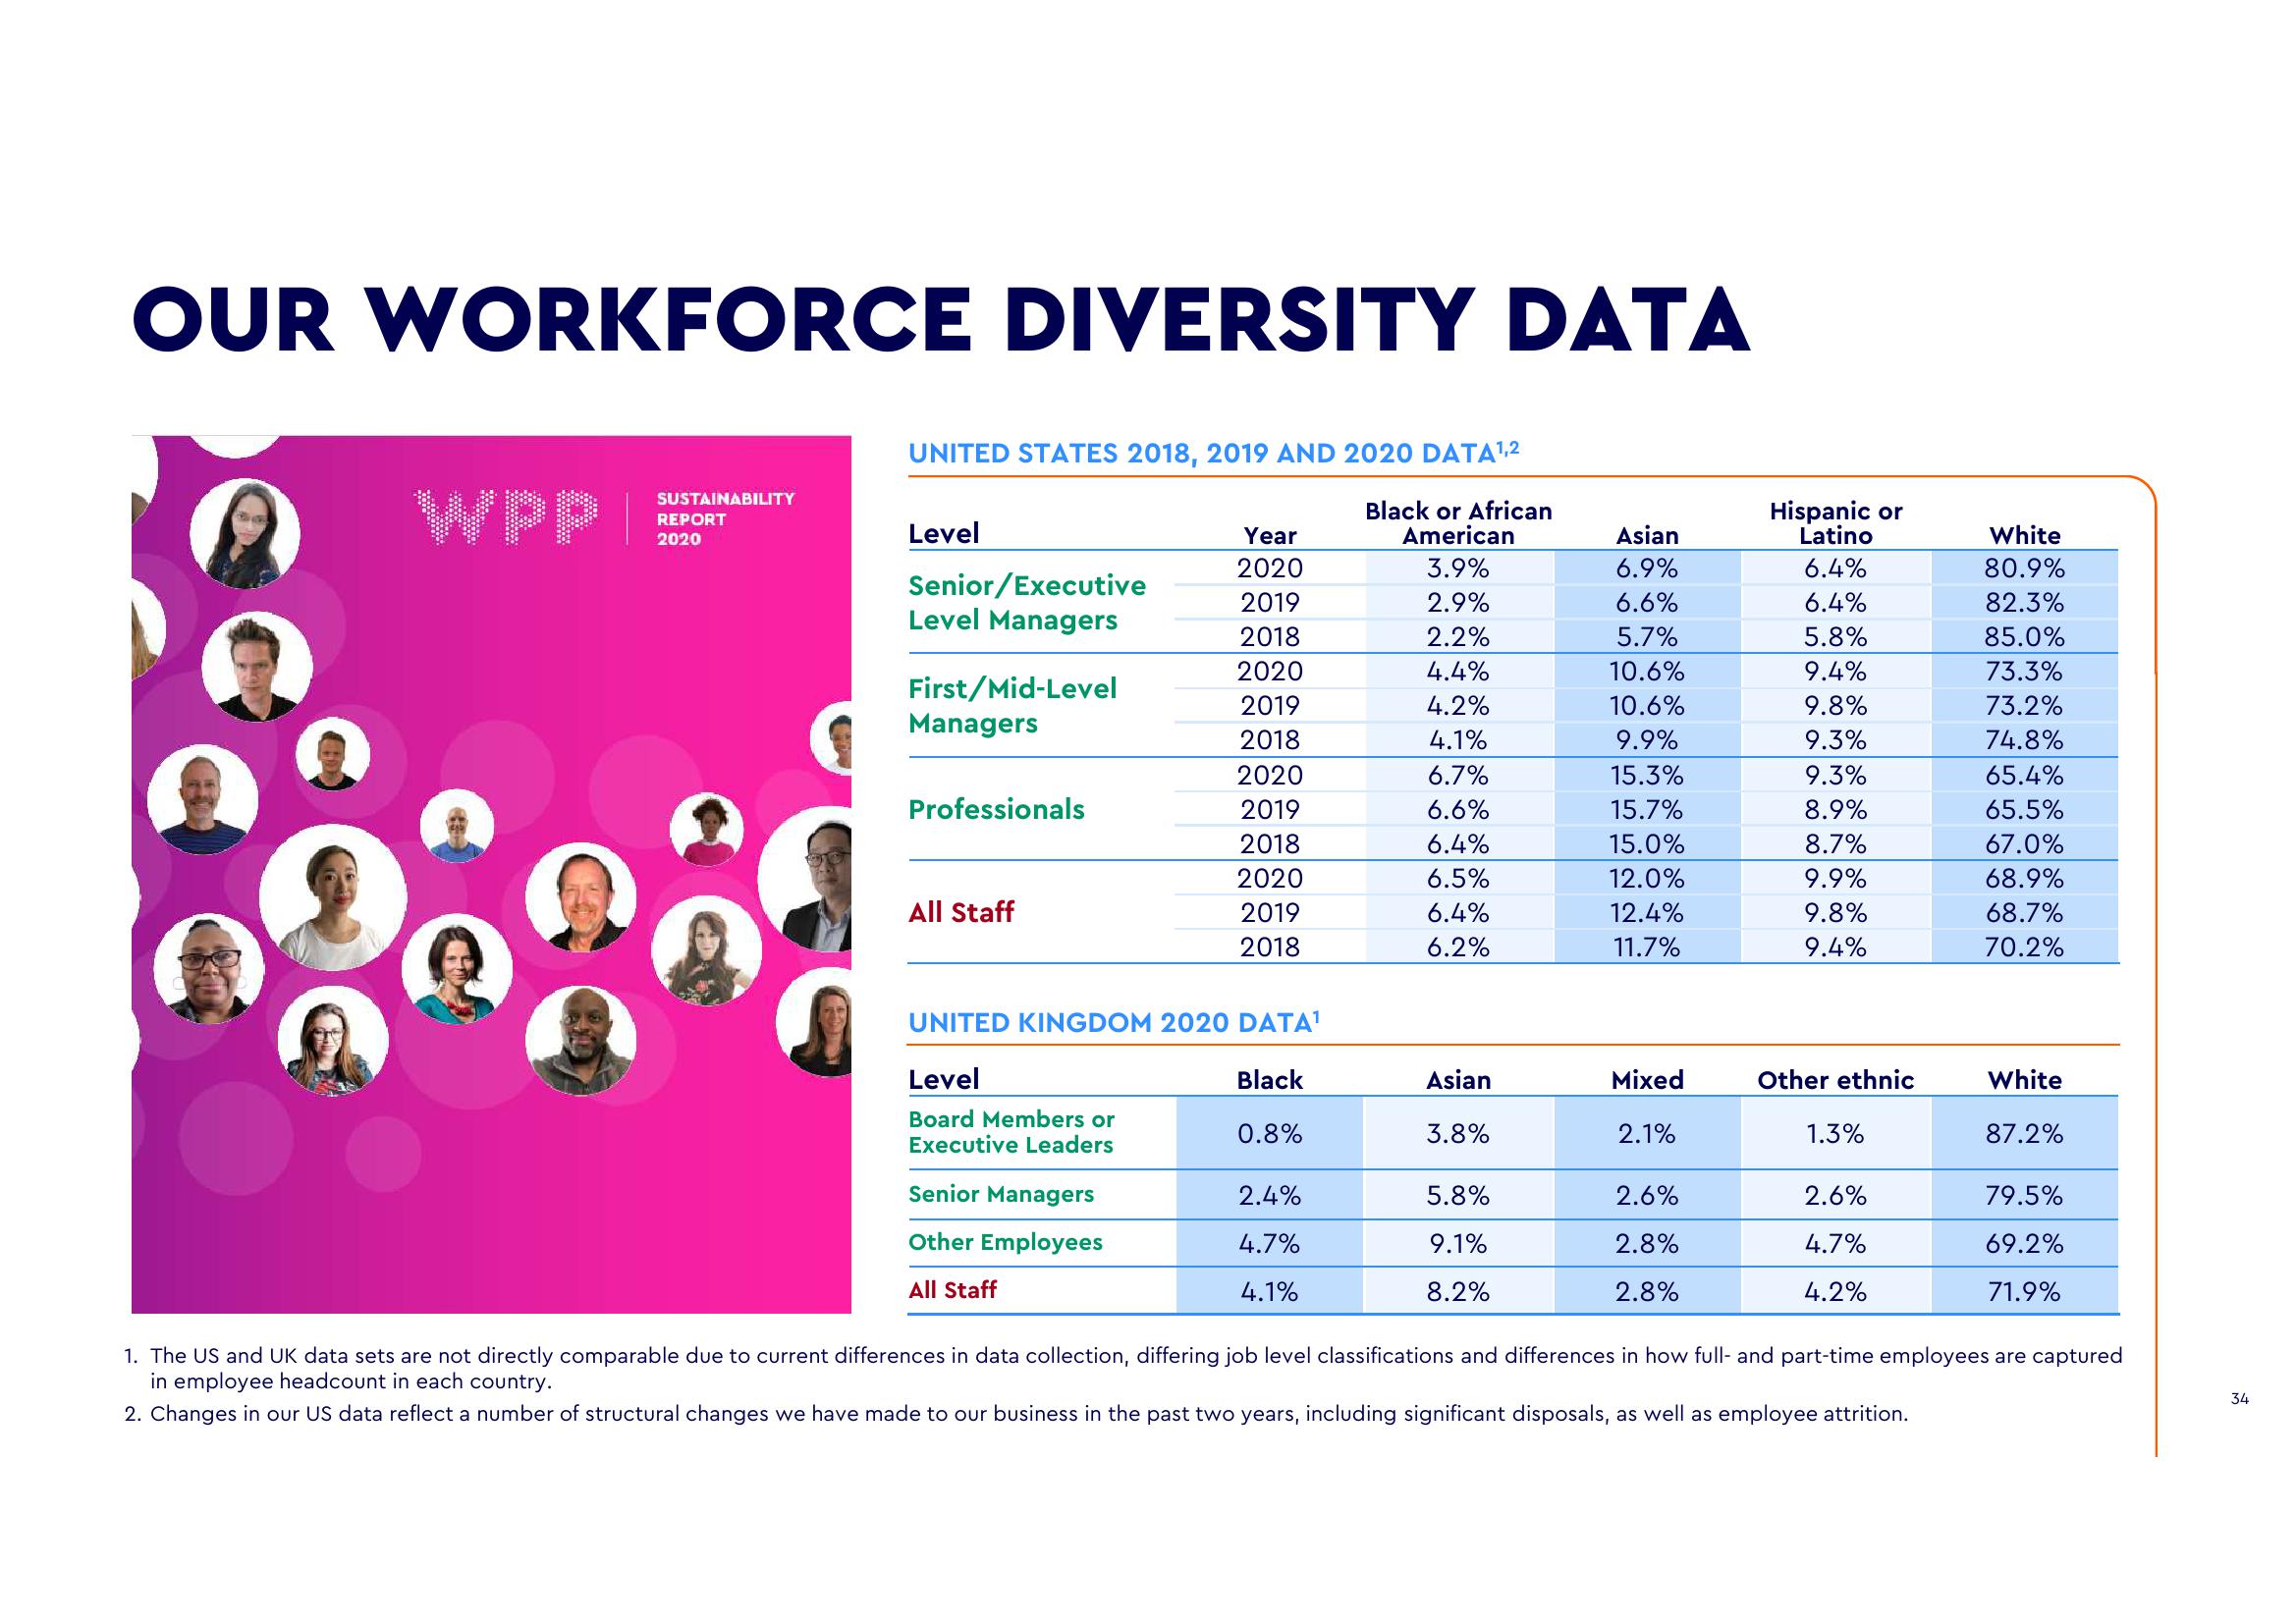
OUR WORKFORCE DIVERSITY DATA
WPP|
SUSTAINABILITY
REPORT
2020
S
UNITED STATES 2018, 2019 AND 2020 DATA¹,2
Black or African
American
3.9%
2.9%
2.2%
4.4%
4.2%
4.1%
6.7%
6.6%
6.4%
6.5%
6.4%
6.2%
Level
Senior/Executive
Level Managers
First/Mid-Level
Managers
Professionals
All Staff
Year
2020
2019
2018
2020
2019
2018
2020
2019
2018
2020
2019
2018
UNITED KINGDOM 2020 DATA¹
Level
Black
Board Members or
Executive Leaders
0.8%
Senior Managers
Other Employees
All Staff
2.4%
4.7%
4.1%
Asian
3.8%
5.8%
9.1%
8.2%
Asian
6.9%
6.6%
5.7%
10.6%
10.6%
9.9%
15.3%
15.7%
15.0%
12.0%
12.4%
11.7%
Mixed
2.1%
2.6%
2.8%
2.8%
Hispanic or
Latino
6.4%
6.4%
5.8%
9.4%
9.8%
9.3%
9.3%
8.9%
8.7%
9.9%
9.8%
9.4%
Other ethnic
1.3%
2.6%
4.7%
4.2%
White
80.9%
82.3%
85.0%
73.3%
73.2%
74.8%
65.4%
65.5%
67.0%
68.9%
68.7%
70.2%
White
87.2%
79.5%
69.2%
71.9%
1. The US and UK data sets are not directly comparable due to current differences in data collection, differing job level classifications and differences in how full- and part-time employees are captured
in employee headcount in each country.
2. Changes in our US data reflect a number of structural changes we have made to our business in the past two years, including significant disposals, as well as employee attrition.
34View entire presentation