Xometry Mergers and Acquisitions Presentation Deck
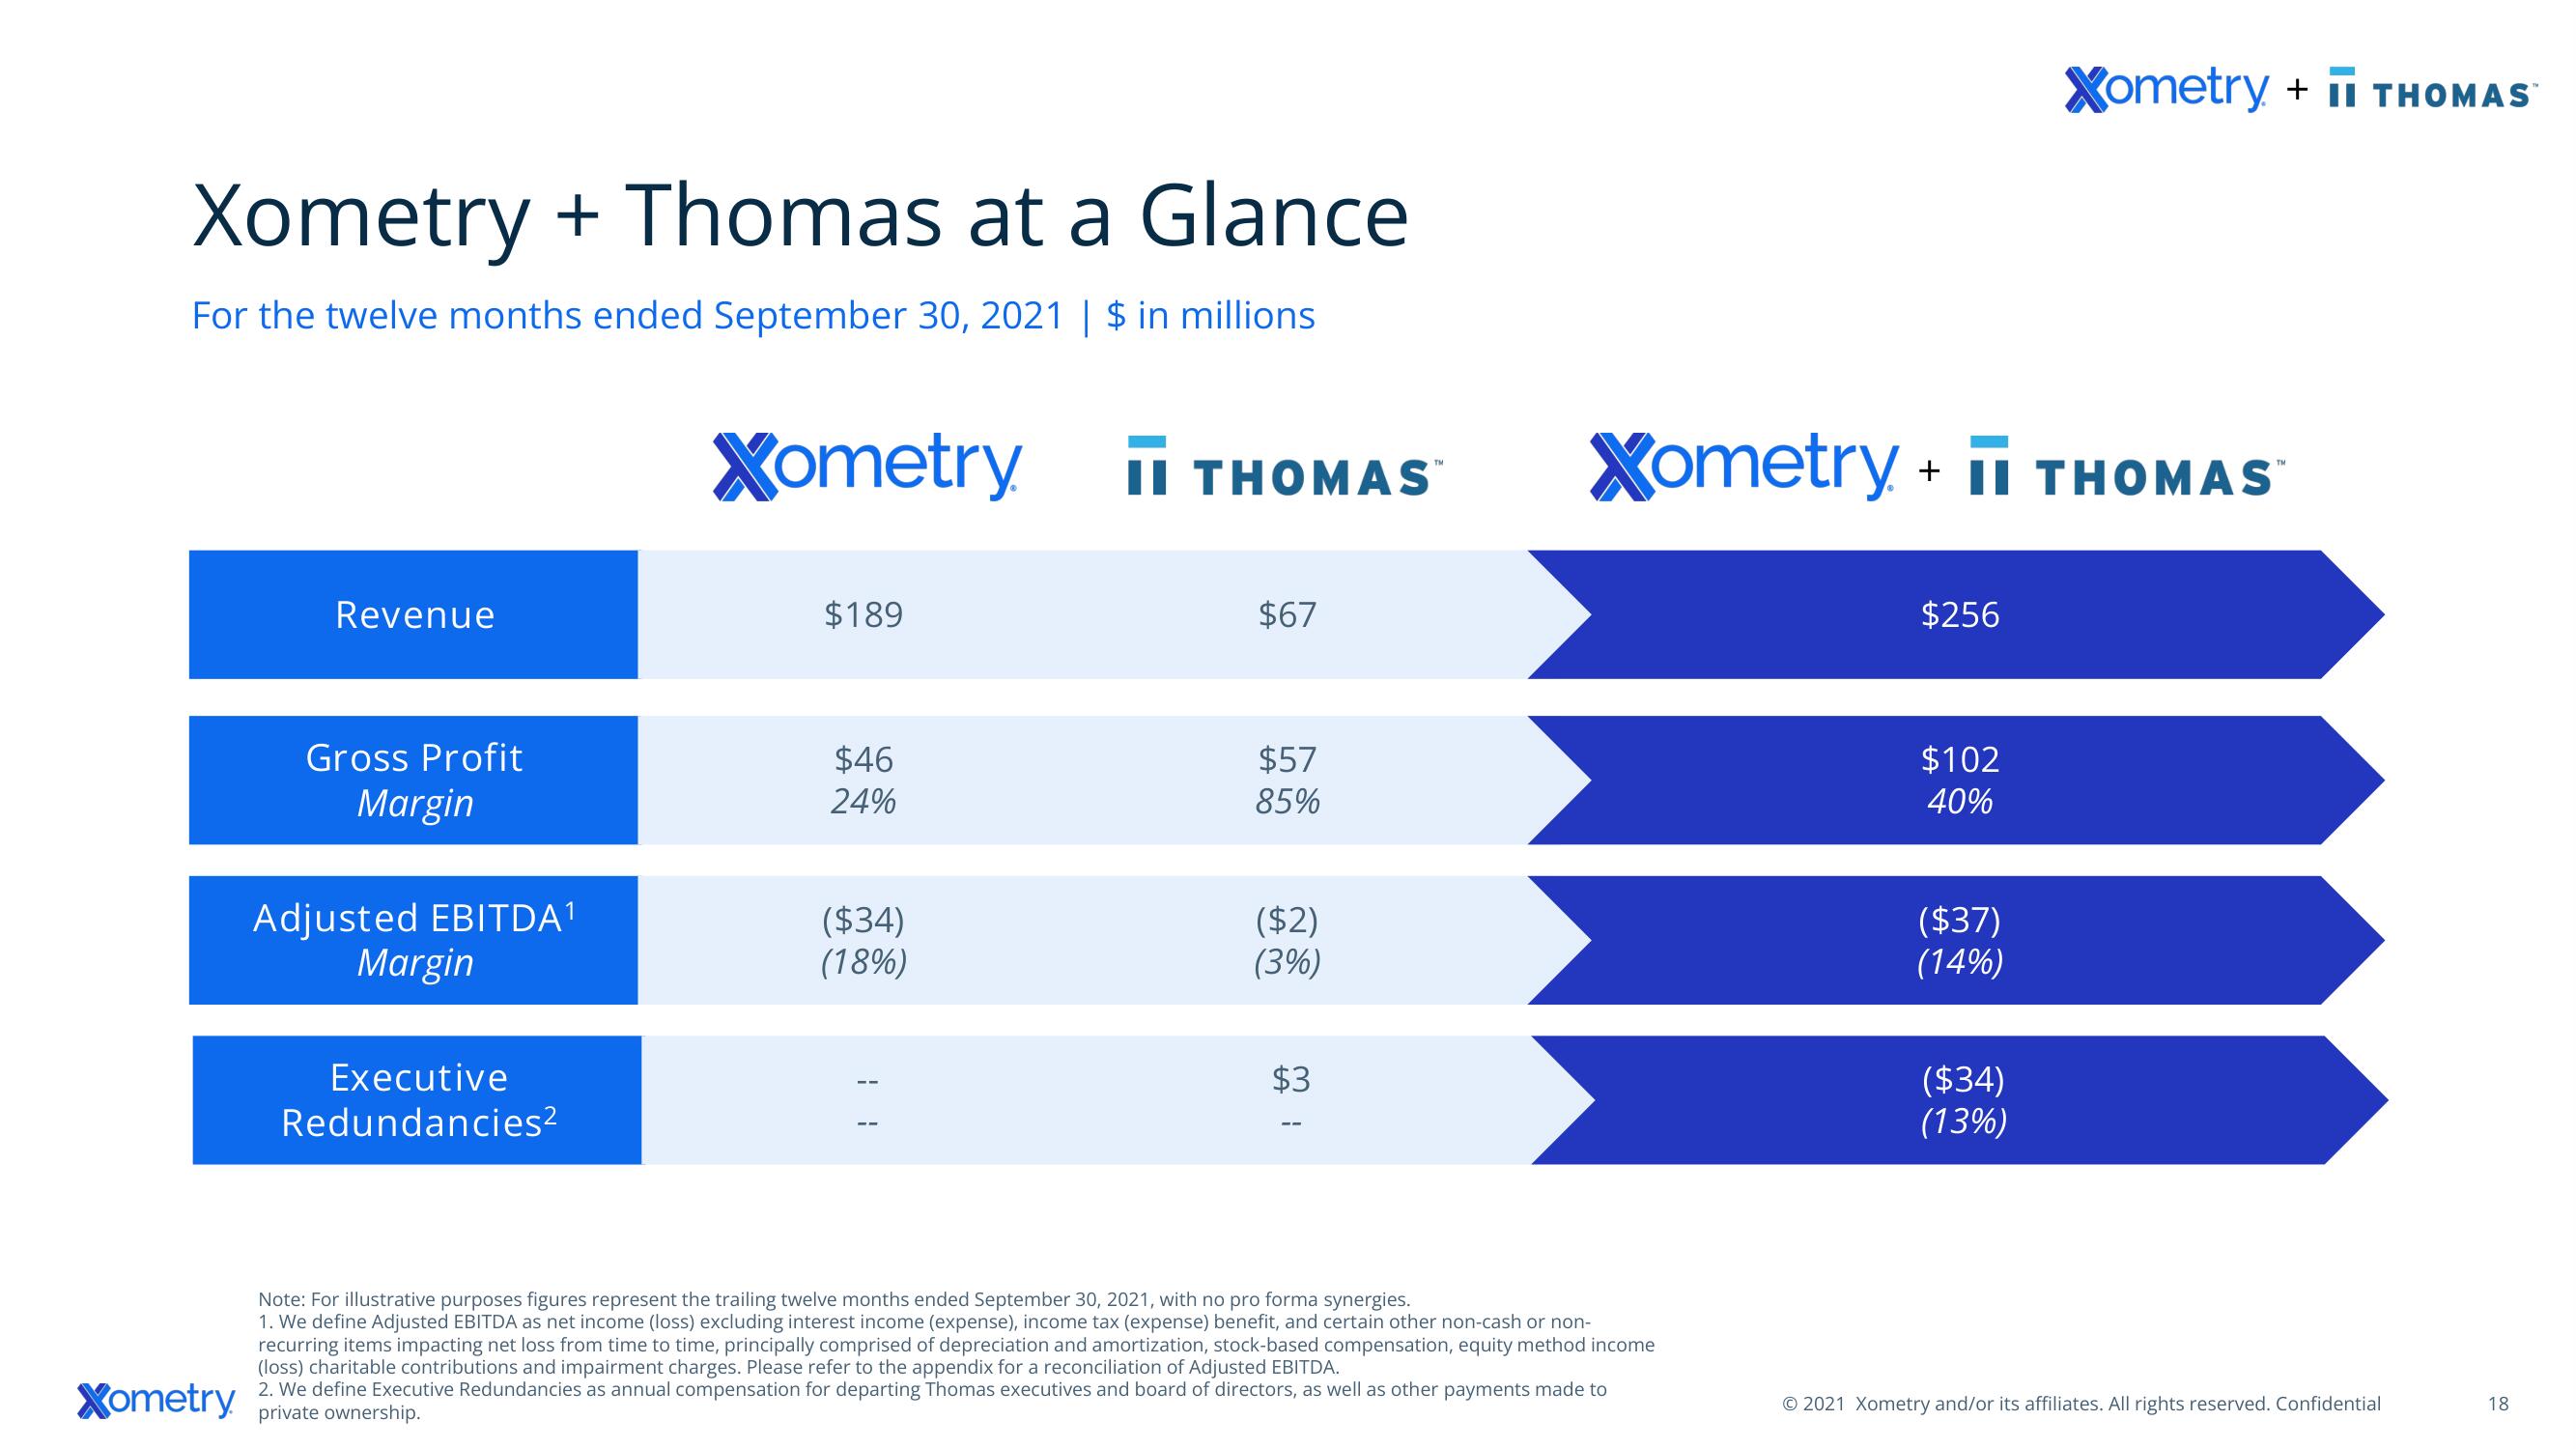
Xometry + Thomas at a Glance
For the twelve months ended September 30, 2021 | $ in millions
Xometry
Revenue
Gross Profit
Margin
Adjusted EBITDA¹
Margin
Executive
Redundancies²
Xometry.
$189
$46
24%
($34)
(18%)
II THOMAS
$67
$57
85%
($2)
(3%)
$3
TM
Xometry + II THOMAS
Note: For illustrative purposes figures represent the trailing twelve months ended September 30, 2021, with no pro forma synergies.
1. We define Adjusted EBITDA as net income (loss) excluding interest income (expense), income tax (expense) benefit, and certain other non-cash or non-
recurring items impacting net loss from time to time, principally comprised of depreciation and amortization, stock-based compensation, equity method income
(loss) charitable contributions and impairment charges. Please refer to the appendix for a reconciliation of Adjusted EBITDA.
2. We define Executive Redundancies as annual compensation for departing Thomas executives and board of directors, as well as other payments made to
private ownership.
$256
$102
40%
($37)
(14%)
Xometry + I THOMAS
($34)
(13%)
TM
© 2021 Xometry and/or its affiliates. All rights reserved. Confidential
18View entire presentation