Main Street Capital Investor Presentation Deck
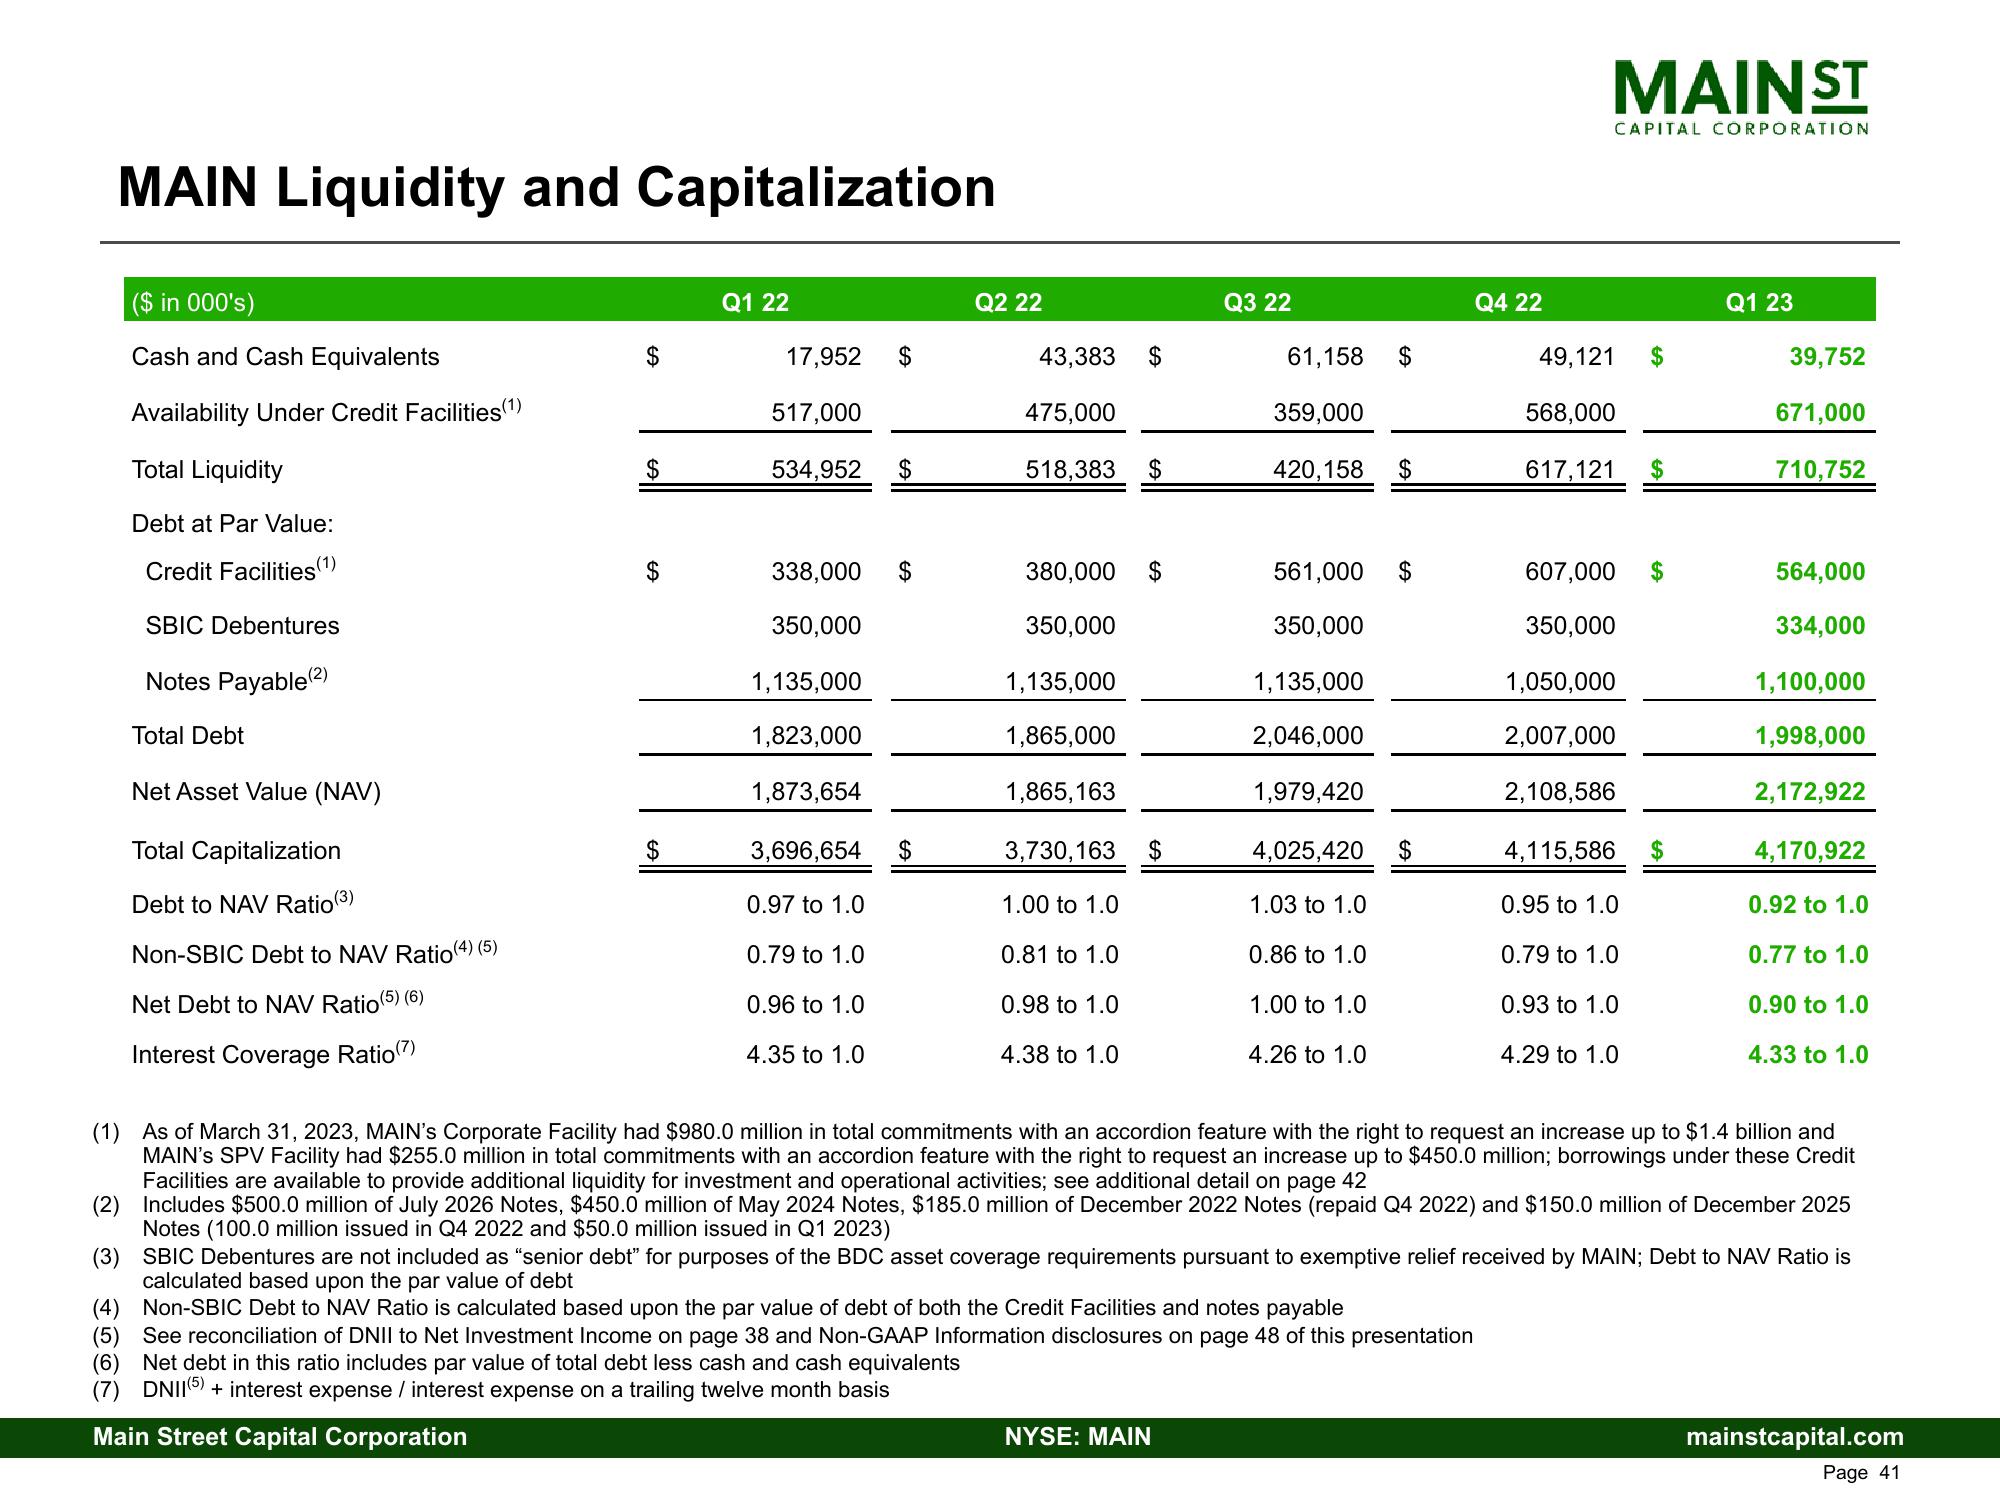
MAIN Liquidity and Capitalization
($ in 000's)
Cash and Cash Equivalents
Availability Under Credit Facilities (1)
Total Liquidity
Debt at Par Value:
Credit Facilities (1)
SBIC Debentures
Notes Payable (2)
Total Debt
Net Asset Value (NAV)
Total Capitalization
Debt to NAV Ratio (3)
Non-SBIC Debt to NAV Ratio (4) (5)
Net Debt to NAV Ratio (5) (6)
Interest Coverage Ratio (7)
$
$
$
Q1 22
17,952
517,000
534,952 $
338,000 $
350,000
1,135,000
1,823,000
1,873,654
3,696,654
0.97 to 1.0
0.79 to 1.0
0.96 to 1.0
4.35 to 1.0
Q2 22
43,383
475,000
518,383
$
380,000 $
350,000
1,135,000
1,865,000
1,865,163
3,730,163
1.00 to 1.0
0.81 to 1.0
0.98 to 1.0
4.38 to 1.0
$
Q3 22
61,158
359,000
420,158 $
NYSE: MAIN
$
561,000 $
350,000
1,135,000
2,046,000
1,979,420
4,025,420
1.03 to 1.0
0.86 to 1.0
1.00 to 1.0
4.26 to 1.0
Q4 22
(5) See reconciliation of DNII to Net Investment Income on page 38 and Non-GAAP Information disclosures on page 48 of this presentation
(6) Net debt in this ratio includes par value of total debt less cash and cash equivalents
(7) DNII(5) + interest expense / interest expense on a trailing twelve month basis
Main Street Capital Corporation
MAIN ST
CAPITAL CORPORATION
49,121
568,000
617,121
607,000
350,000
1,050,000
2,007,000
2,108,586
4,115,586
0.95 to 1.0
0.79 to 1.0
0.93 to 1.0
4.29 to 1.0
$
$
Q1 23
39,752
671,000
710,752
564,000
334,000
1,100,000
1,998,000
2,172,922
4,170,922
0.92 to 1.0
0.77 to 1.0
0.90 to 1.0
(1) As of March 31, 2023, MAIN's Corporate Facility had $980.0 million in total commitments with an accordion feature with the right to request an increase up to $1.4 billion and
MAIN's SPV Facility had $255.0 million in total commitments with an accordion feature with the right to request an increase up to $450.0 million; borrowings under these Credit
Facilities are available to provide additional liquidity for investment and operational activities; see additional detail on page 42
(2) Includes $500.0 million of July 2026 Notes, $450.0 million of May 2024 Notes, $185.0 million of December 2022 Notes (repaid Q4 2022) and $150.0 million of December 2025
Notes (100.0 million issued in Q4 2022 and $50.0 million issued in Q1 2023)
4.33 to 1.0
(3) SBIC Debentures are not included as "senior debt" for purposes of the BDC asset coverage requirements pursuant to exemptive relief received by MAIN; Debt to NAV Ratio is
calculated based upon the par value of debt
(4) Non-SBIC Debt to NAV Ratio is calculated based upon the par value of debt of both the Credit Facilities and notes payable
mainstcapital.com
Page 41View entire presentation