Maersk Investor Presentation Deck
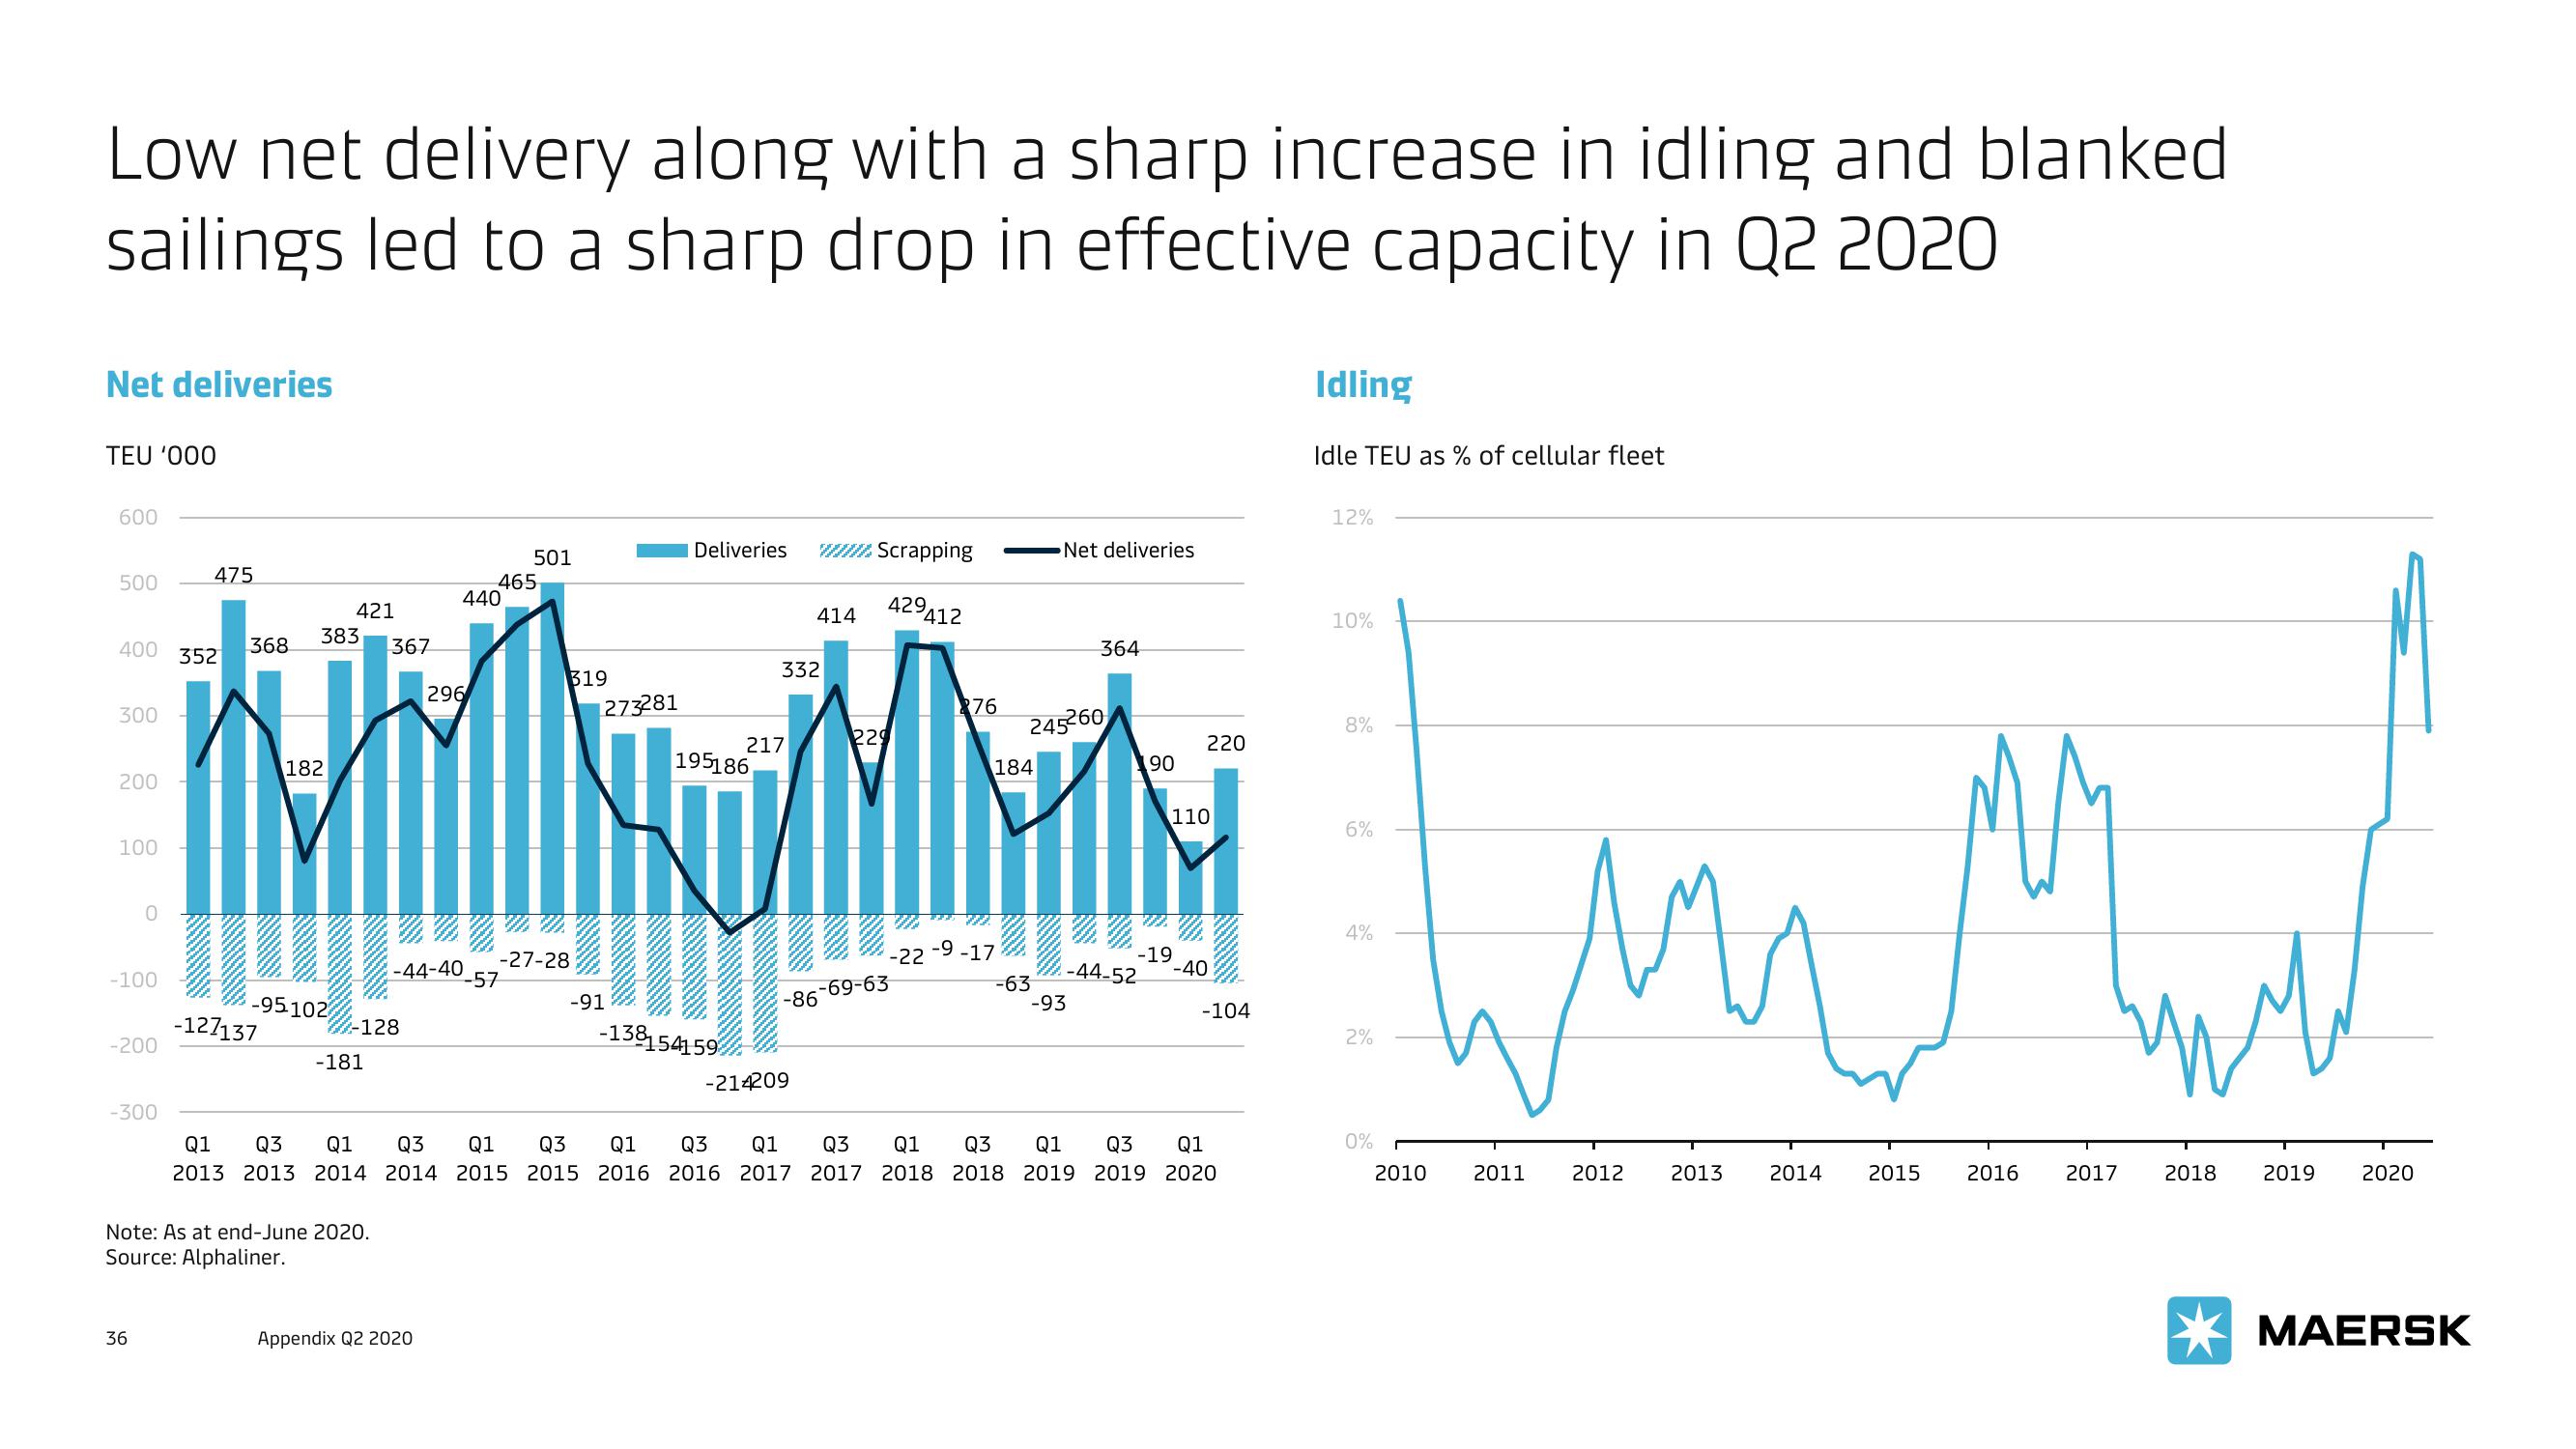
Low net delivery along with a sharp increase in idling and blanked
sailings led to a sharp drop in effective capacity in Q2 2020
Net deliveries
TEU '000
600
500
400 352
300
200
100
-100
-200
-300
475
36
368
182
II
-127137
383
421
-95102
-181
367
-128
Note: As at end-June 2020.
Source: Alphaliner.
-44-40
440
296
Appendix Q2 2020
465
501
-57
319
-27-28
273281
-91
Deliveries
195186
-138154159
217
332
414
-86
-214209
Scrapping
429412
229
-69-63
276
184
-9
-22 -17
Net deliveries
245260
364
-63
-93
-44-52
90
220
110
-19
-40
Q1
Q3 Q1 Q3 Q1 Q3 Q1 Q3
Q1
Q3 Q1 Q3
2013 2013 2014 2014 2015 2015 2016 2016 2017 2017 2018 2018 2019 2019 2020
Q1
Q3 Q1
-104
Idling
Idle TEU as % of cellular fleet
12%
10%
8%
6%
4%
2%
0%
M
2010 2011
2012
2013 2014 2015
M.M
2016
2017 2018 2019
2020
MAERSKView entire presentation