HSBC Investor Day Presentation Deck
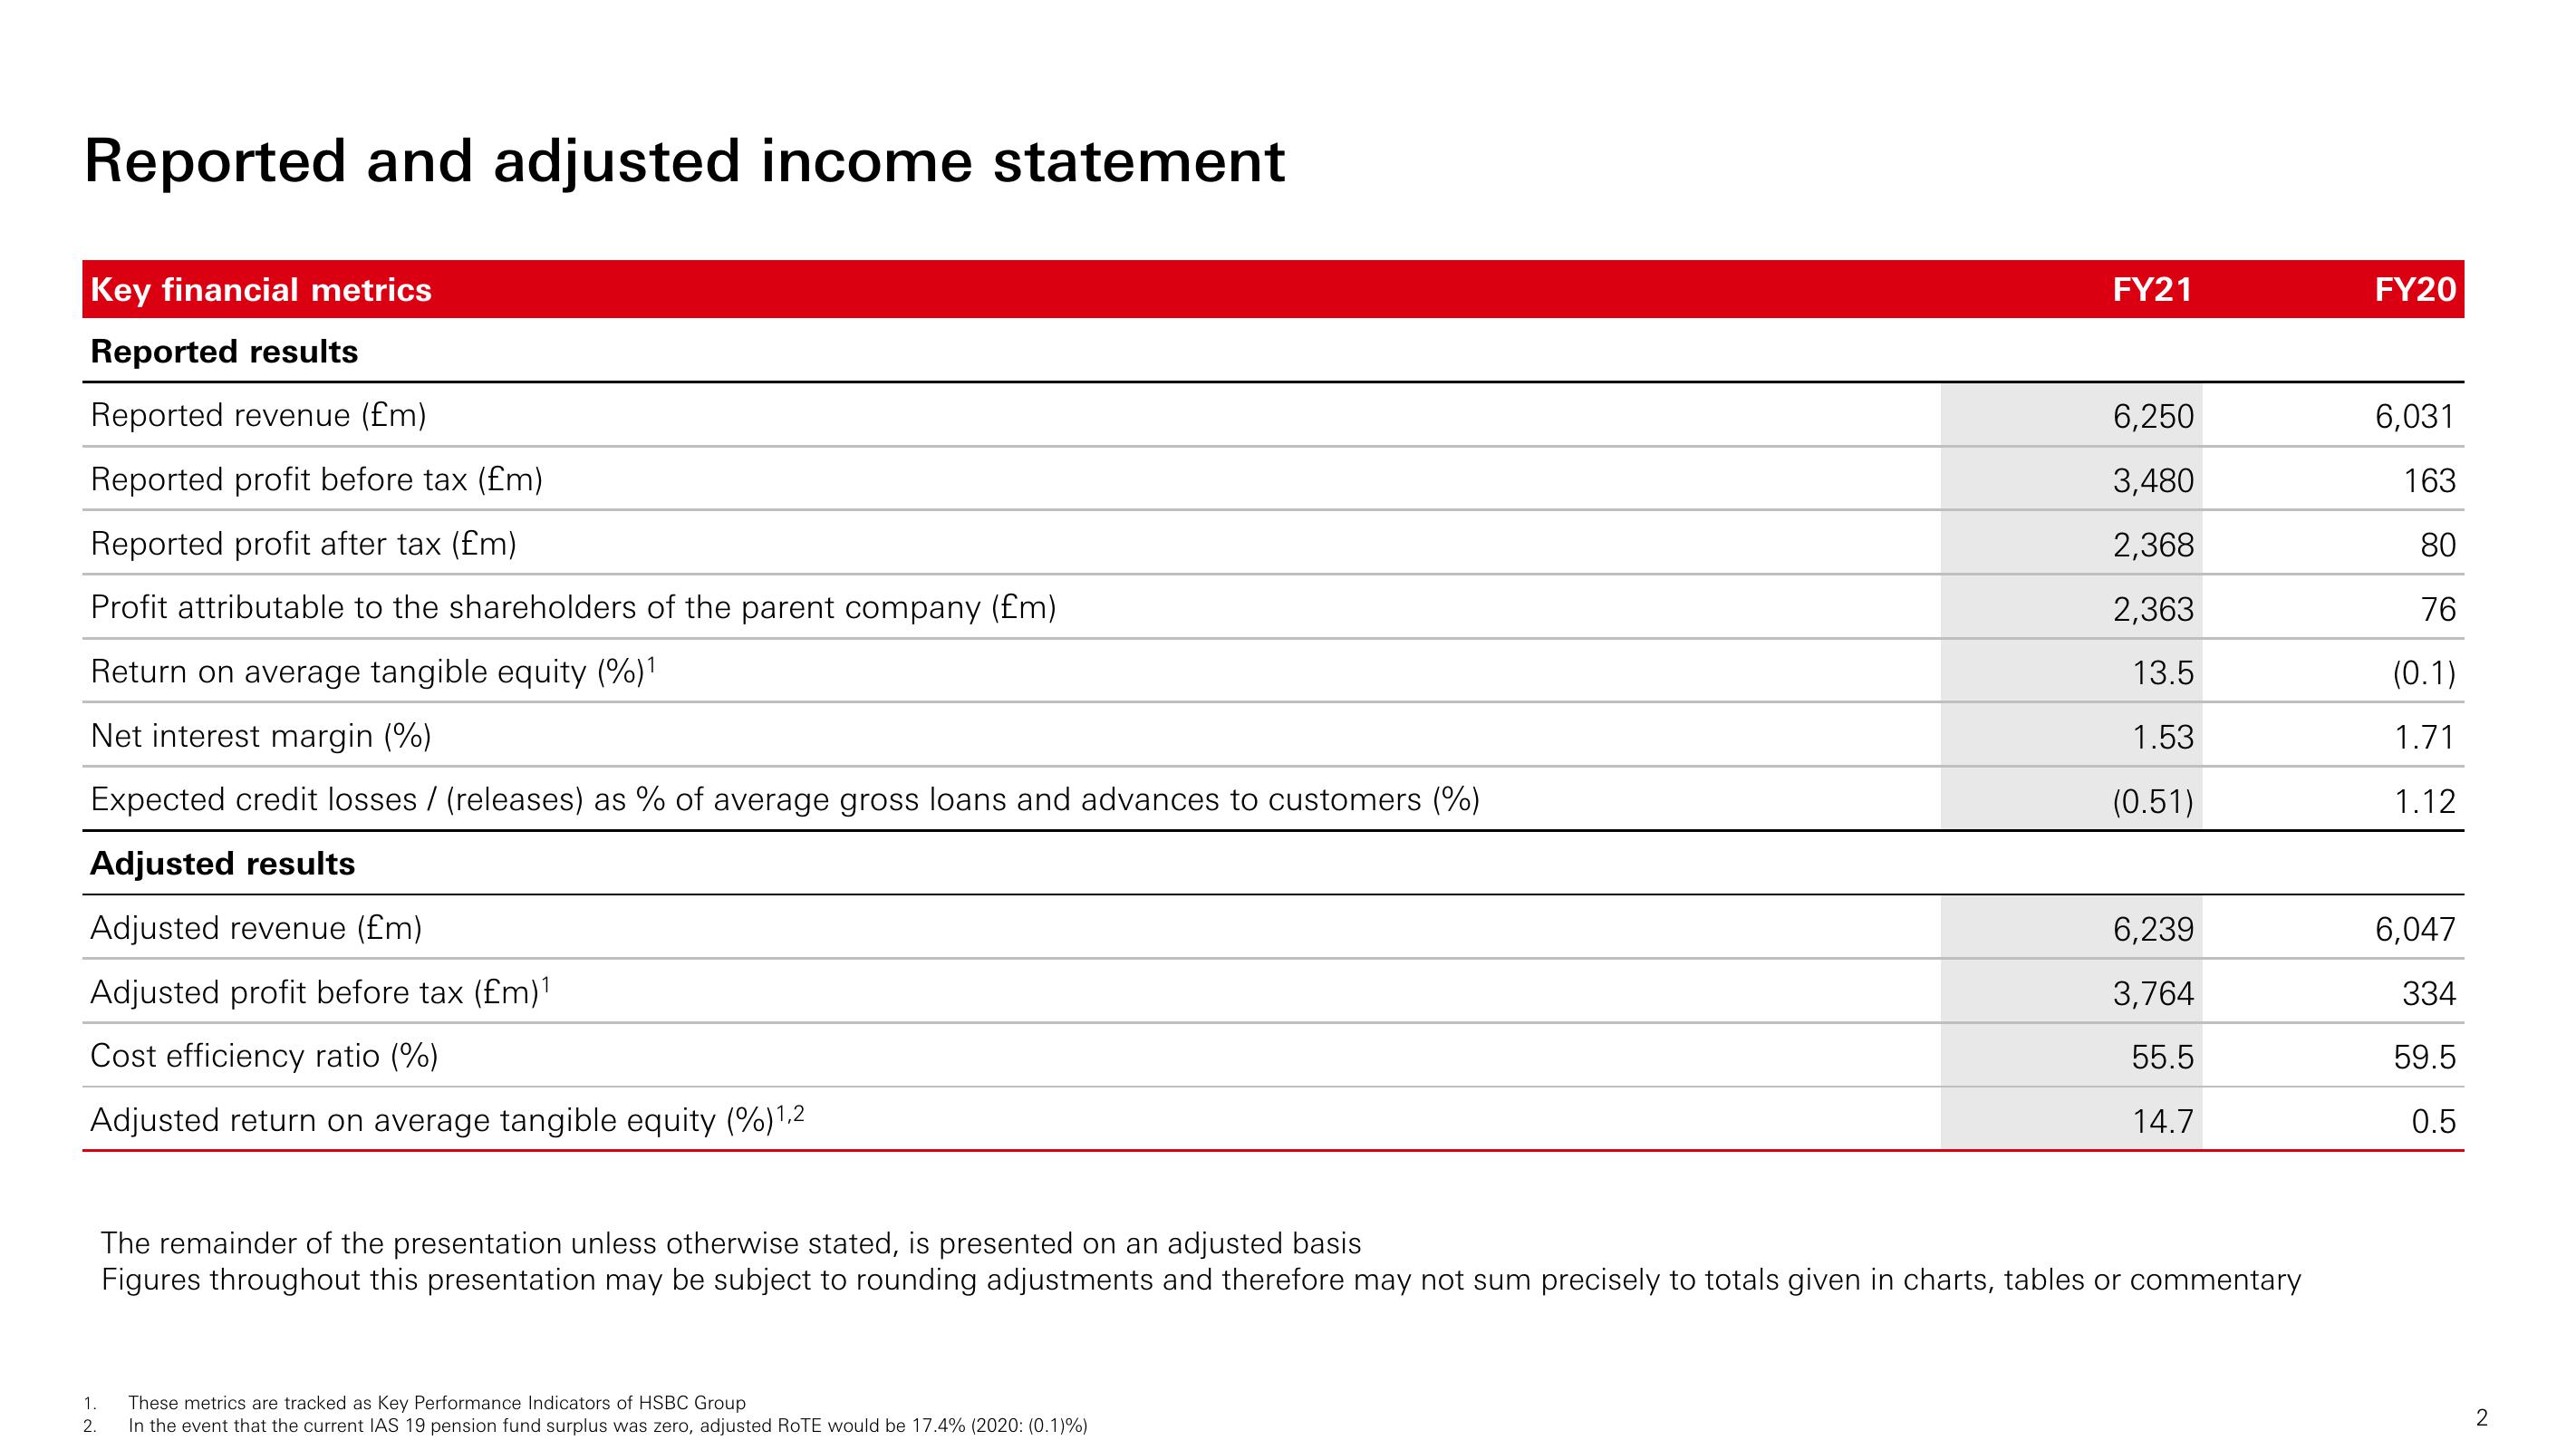
Reported and adjusted income statement
Key financial metrics
Reported results
Reported revenue (£m)
Reported profit before tax (£m)
Reported profit after tax (£m)
Profit attributable to the shareholders of the parent company (£m)
Return on average tangible equity (%)¹
Net interest margin (%)
Expected credit losses / (releases) as % of average gross loans and advances to customers (%)
Adjusted results
Adjusted revenue (£m)
Adjusted profit before tax (£m)¹
Cost efficiency ratio (%)
Adjusted return on average tangible equity (%) 1,2
1.
2.
FY21
These metrics are tracked as Key Performance Indicators of HSBC Group
In the event that the current IAS 19 pension fund surplus was zero, adjusted ROTE would be 17.4% (2020: (0.1)%)
6,250
3,480
2,368
2,363
13.5
1.53
(0.51)
6,239
3,764
55.5
14.7
The remainder of the presentation unless otherwise stated, is presented on an adjusted basis
Figures throughout this presentation may be subject to rounding adjustments and therefore may not sum precisely to totals given in charts, tables or commentary
FY20
6,031
163
80
76
(0.1)
1.71
1.12
6,047
334
59.5
0.5
2View entire presentation