Altus Power Results Presentation Deck
Track Record of Growth
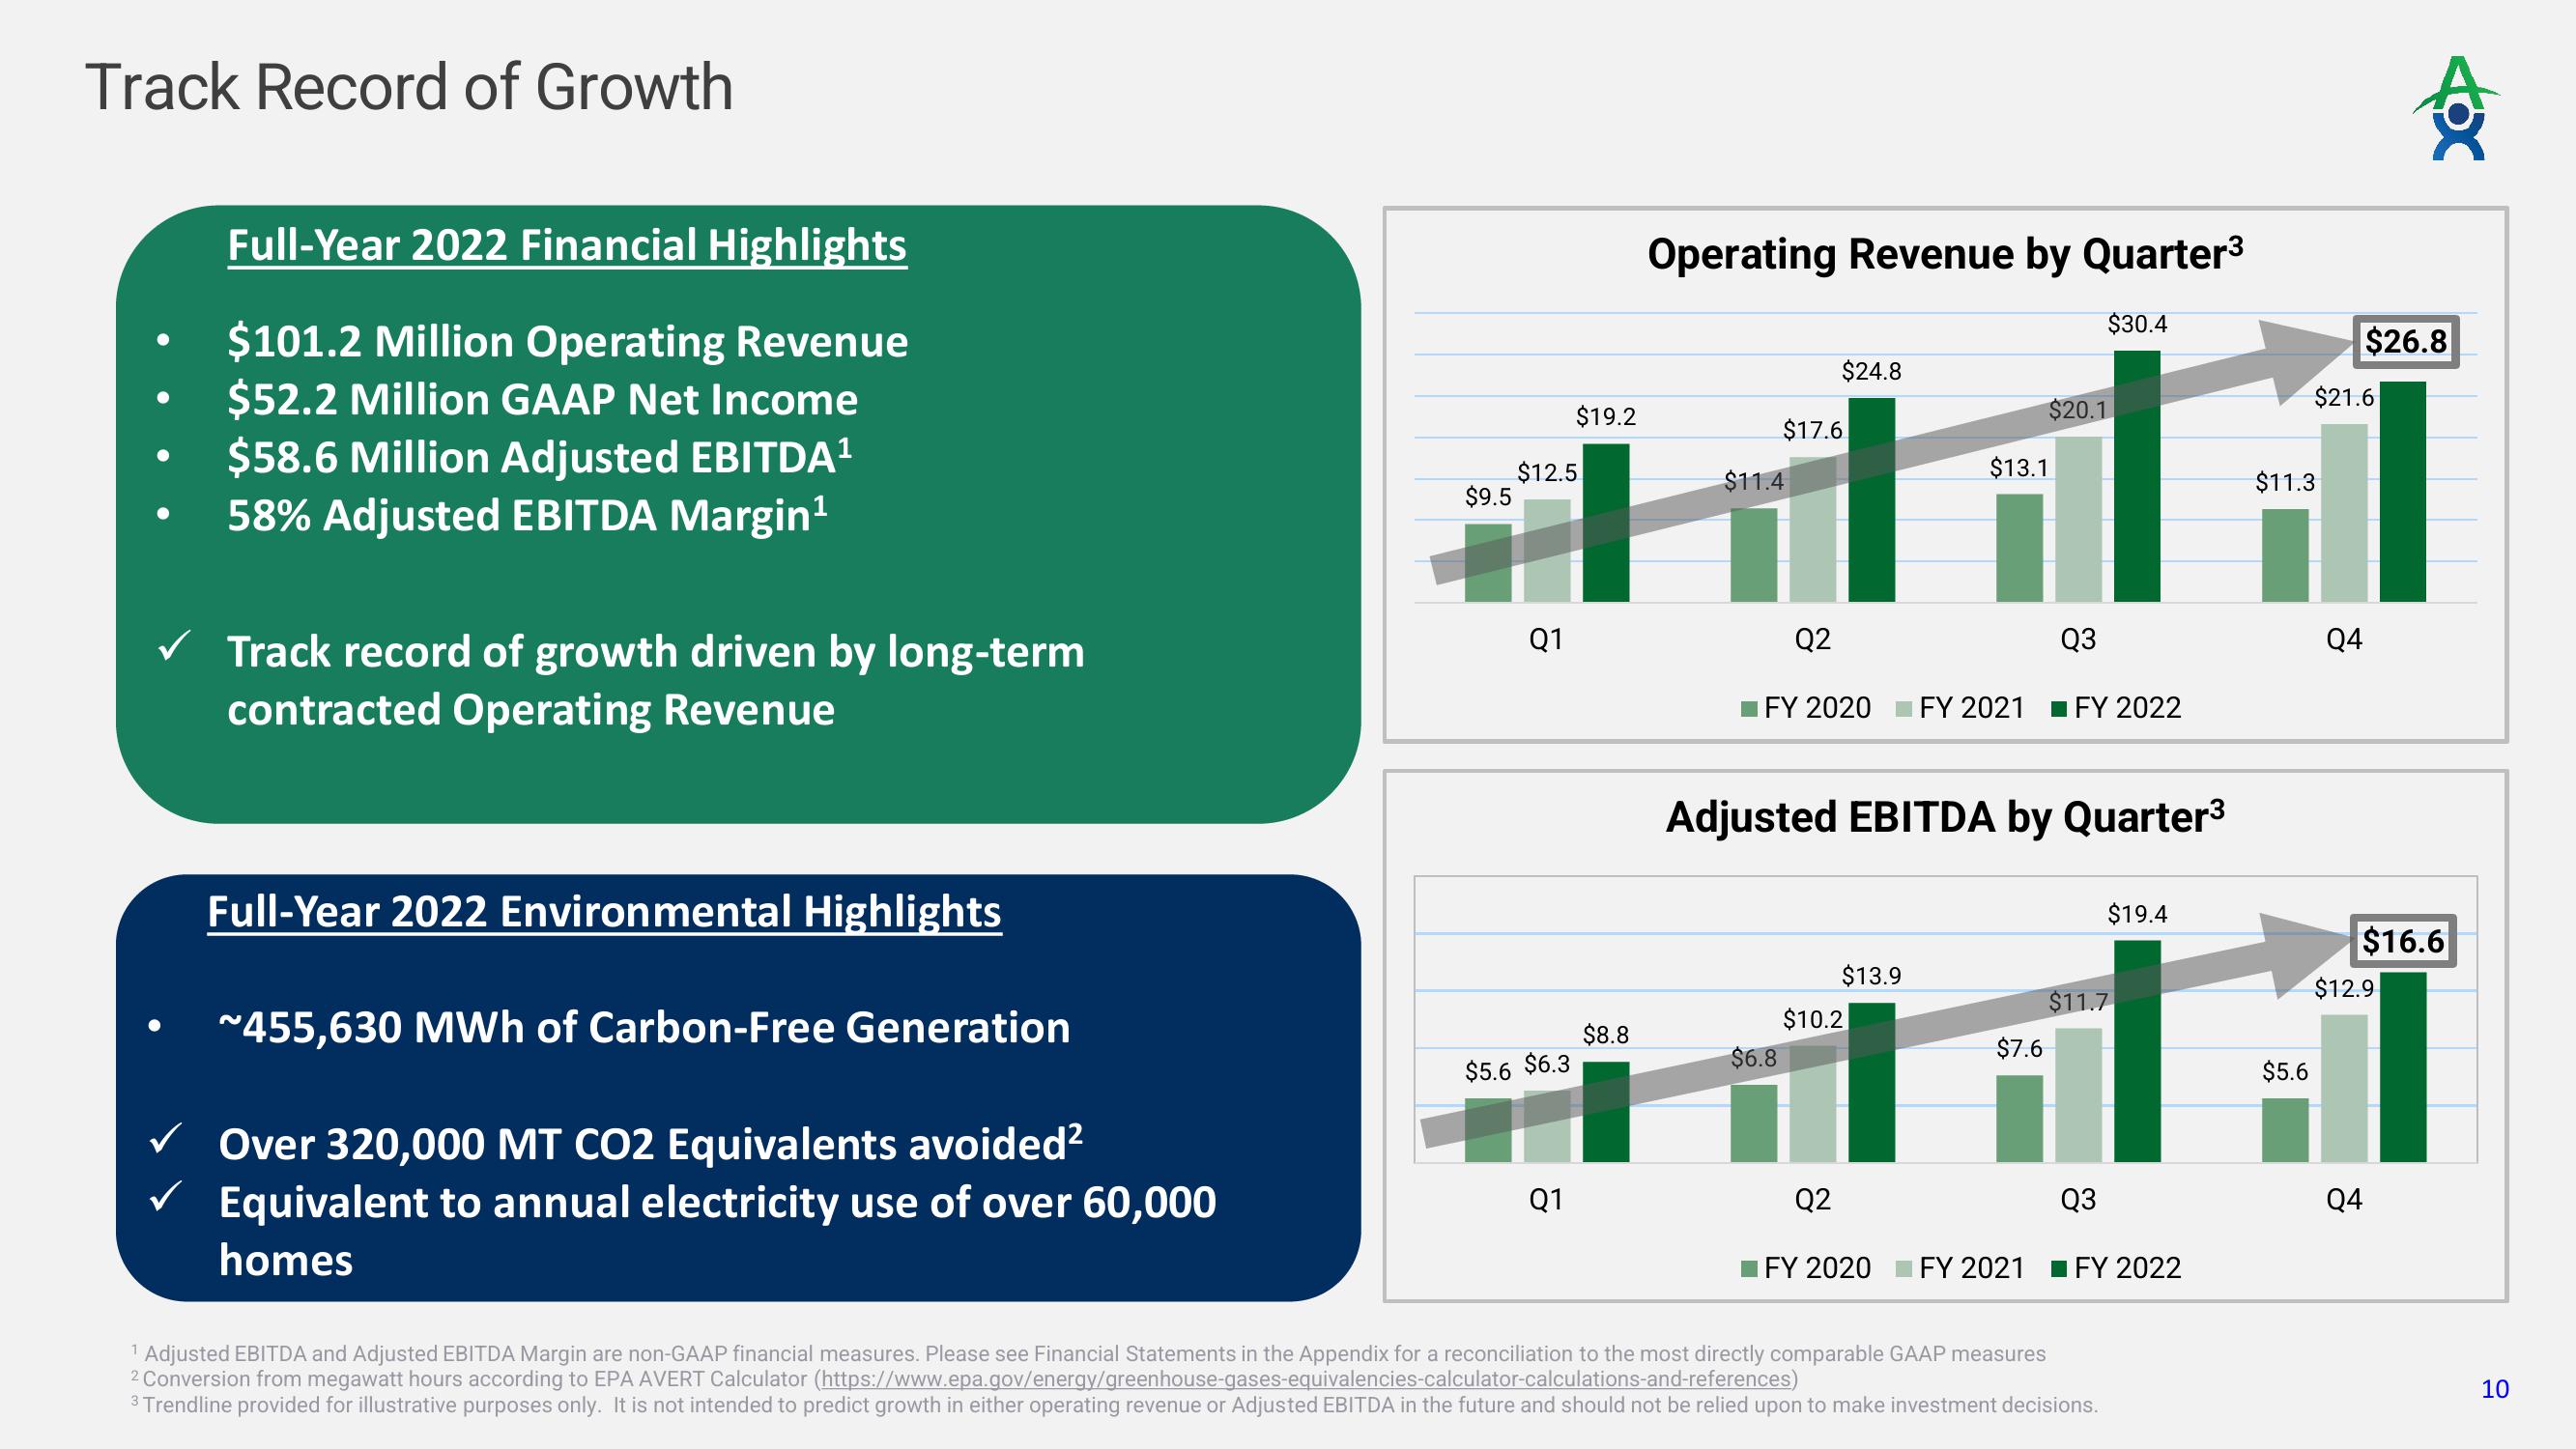
Full-Year 2022 Financial Highlights
$101.2 Million Operating Revenue
$52.2 Million GAAP Net Income
$58.6 Million Adjusted EBITDA¹
58% Adjusted EBITDA Margin¹
✓ Track record of growth driven by long-term
contracted Operating Revenue
Full-Year 2022 Environmental Highlights
~455,630 MWh of Carbon-Free Generation
Over 320,000 MT CO2 Equivalents avoided²
Equivalent to annual electricity use of over 60,000
homes
$9.5
$12.5
Q1
$5.6 $6.3
$19.2
Q1
$8.8
Operating Revenue by Quarter³
$11.4
$17.6
Q2
$6.8
$24.8
Q2
FY 2020 FY 2021 FY 2022
$13.9
$10.2
$20.1
$13.1
Adjusted EBITDA by Quarter³
Q3
$7.6
$30.4
Q3
$11.7
$19.4
1 Adjusted EBITDA and Adjusted EBITDA Margin are non-GAAP financial measures. Please see Financial Statements in the Appendix for a reconciliation to the most directly comparable GAAP measures
2 Conversion from megawatt hours according to EPA AVERT Calculator (https://www.epa.gov/energy/greenhouse-gases-equivalencies-calculator-calculations-and-references)
3 Trendline provided for illustrative purposes only. It is not intended to predict growth in either operating revenue or Adjusted EBITDA in the future and should not be relied upon to make investment decisions.
FY 2020 FY 2021 ■FY 2022
$11.3
$5.6
$21.6
Q4
$26.8
$16.6
$12.9
Q4
10View entire presentation