Bird Investor Presentation Deck
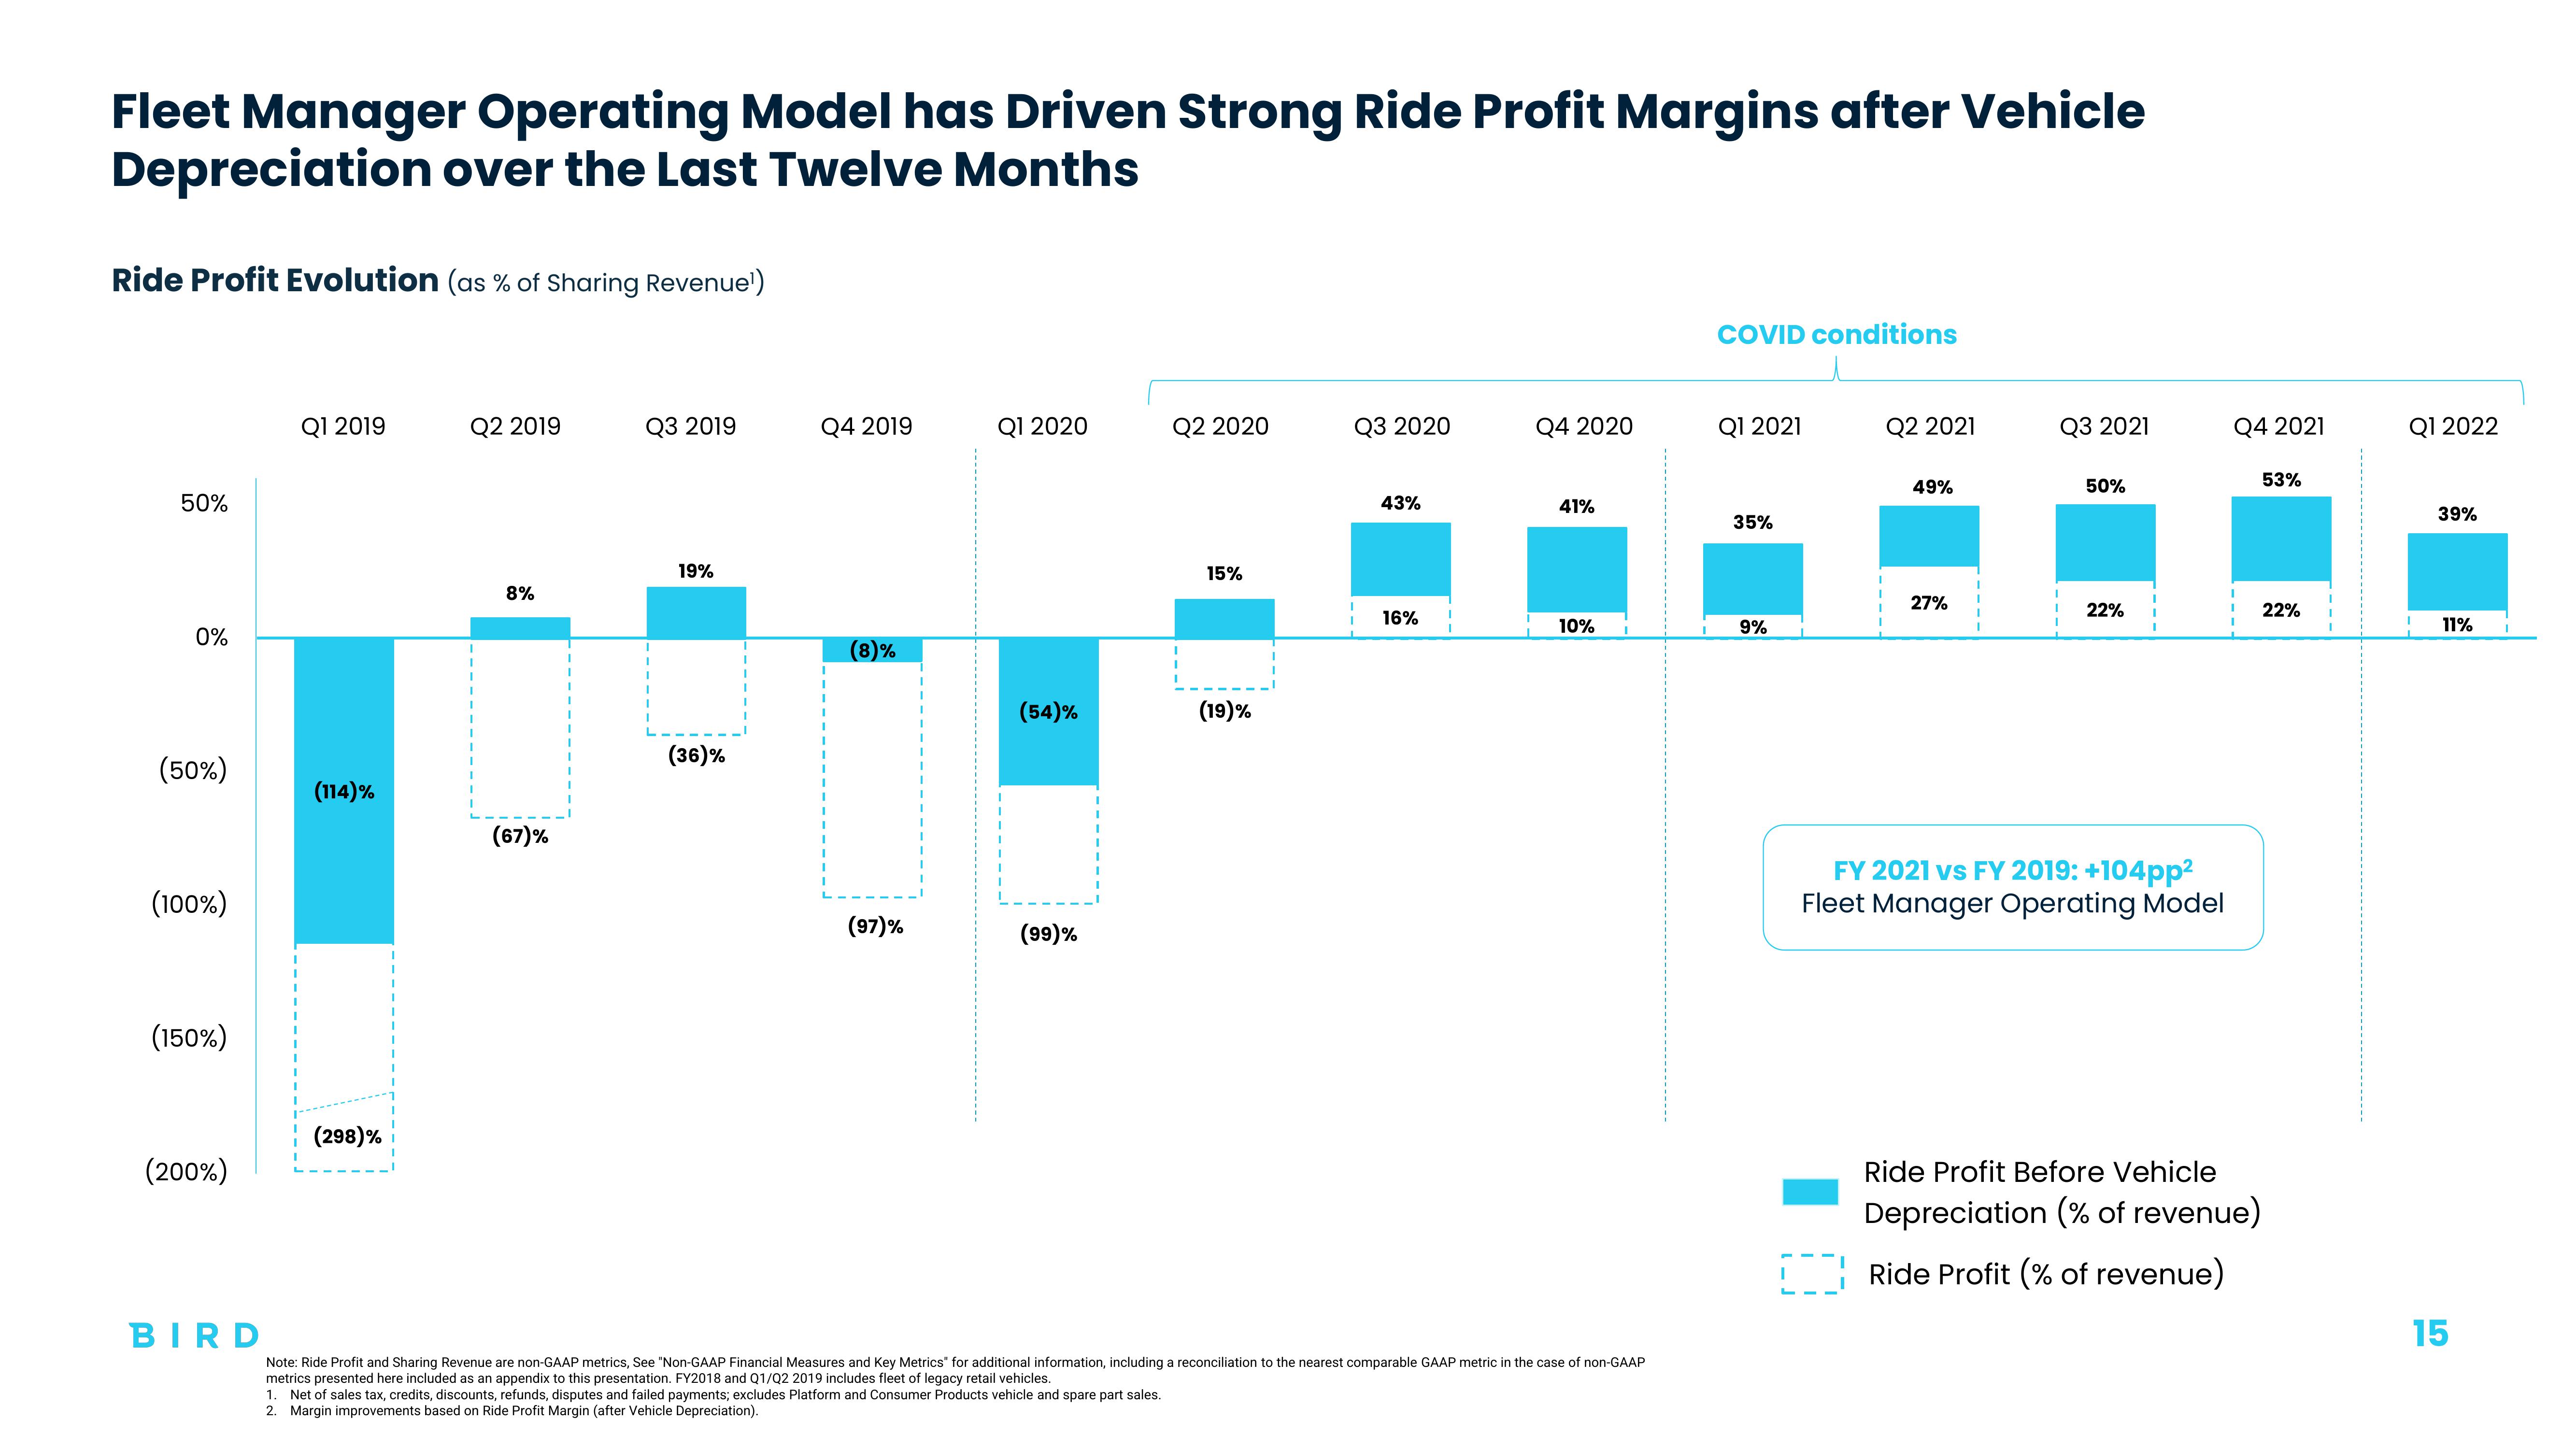
Fleet Manager Operating Model has Driven Strong Ride Profit Margins after Vehicle
Depreciation over the Last Twelve Months
Ride Profit Evolution (as % of Sharing Revenue'¹)
50%
0%
(50%)
(100%)
(150%)
(200%)
BIRD
Q1 2019
(114)%
(298)%
Q2 2019
8%
(67)%
Q3 2019
19%
(36)%
Q4 2019
(8)%
(97)%
Q1 2020
(54)%
(99)%
Q2 2020
15%
(19)%
Q3 2020
43%
16%
Q4 2020
41%
10%
Note: Ride Profit and Sharing Revenue are non-GAAP metrics, See "Non-GAAP Financial Measures and Key Metrics for additional information, including a reconciliation to the nearest comparable GAAP metric in the case of non-GAAP
metrics presented here included as an appendix to this presentation. FY2018 and Q1/Q2 2019 includes fleet of legacy retail vehicles.
1. Net of sales tax, credits, discounts, refunds, disputes and failed payments; excludes Platform and Consumer Products vehicle and spare part sales.
2. Margin improvements based on Ride Profit Margin (after Vehicle Depreciation).
COVID conditions
Q1 2021
35%
9%
Q2 2021
49%
27%
Q3 2021
50%
22%
FY 2021 vs FY 2019: +104pp²
Fleet Manager Operating Model
Q4 2021
Ride Profit Before Vehicle
Depreciation (% of revenue)
Ride Profit (% of revenue)
53%
22%
Q1 2022
39%
11%
15View entire presentation