HBT Financial Results Presentation Deck
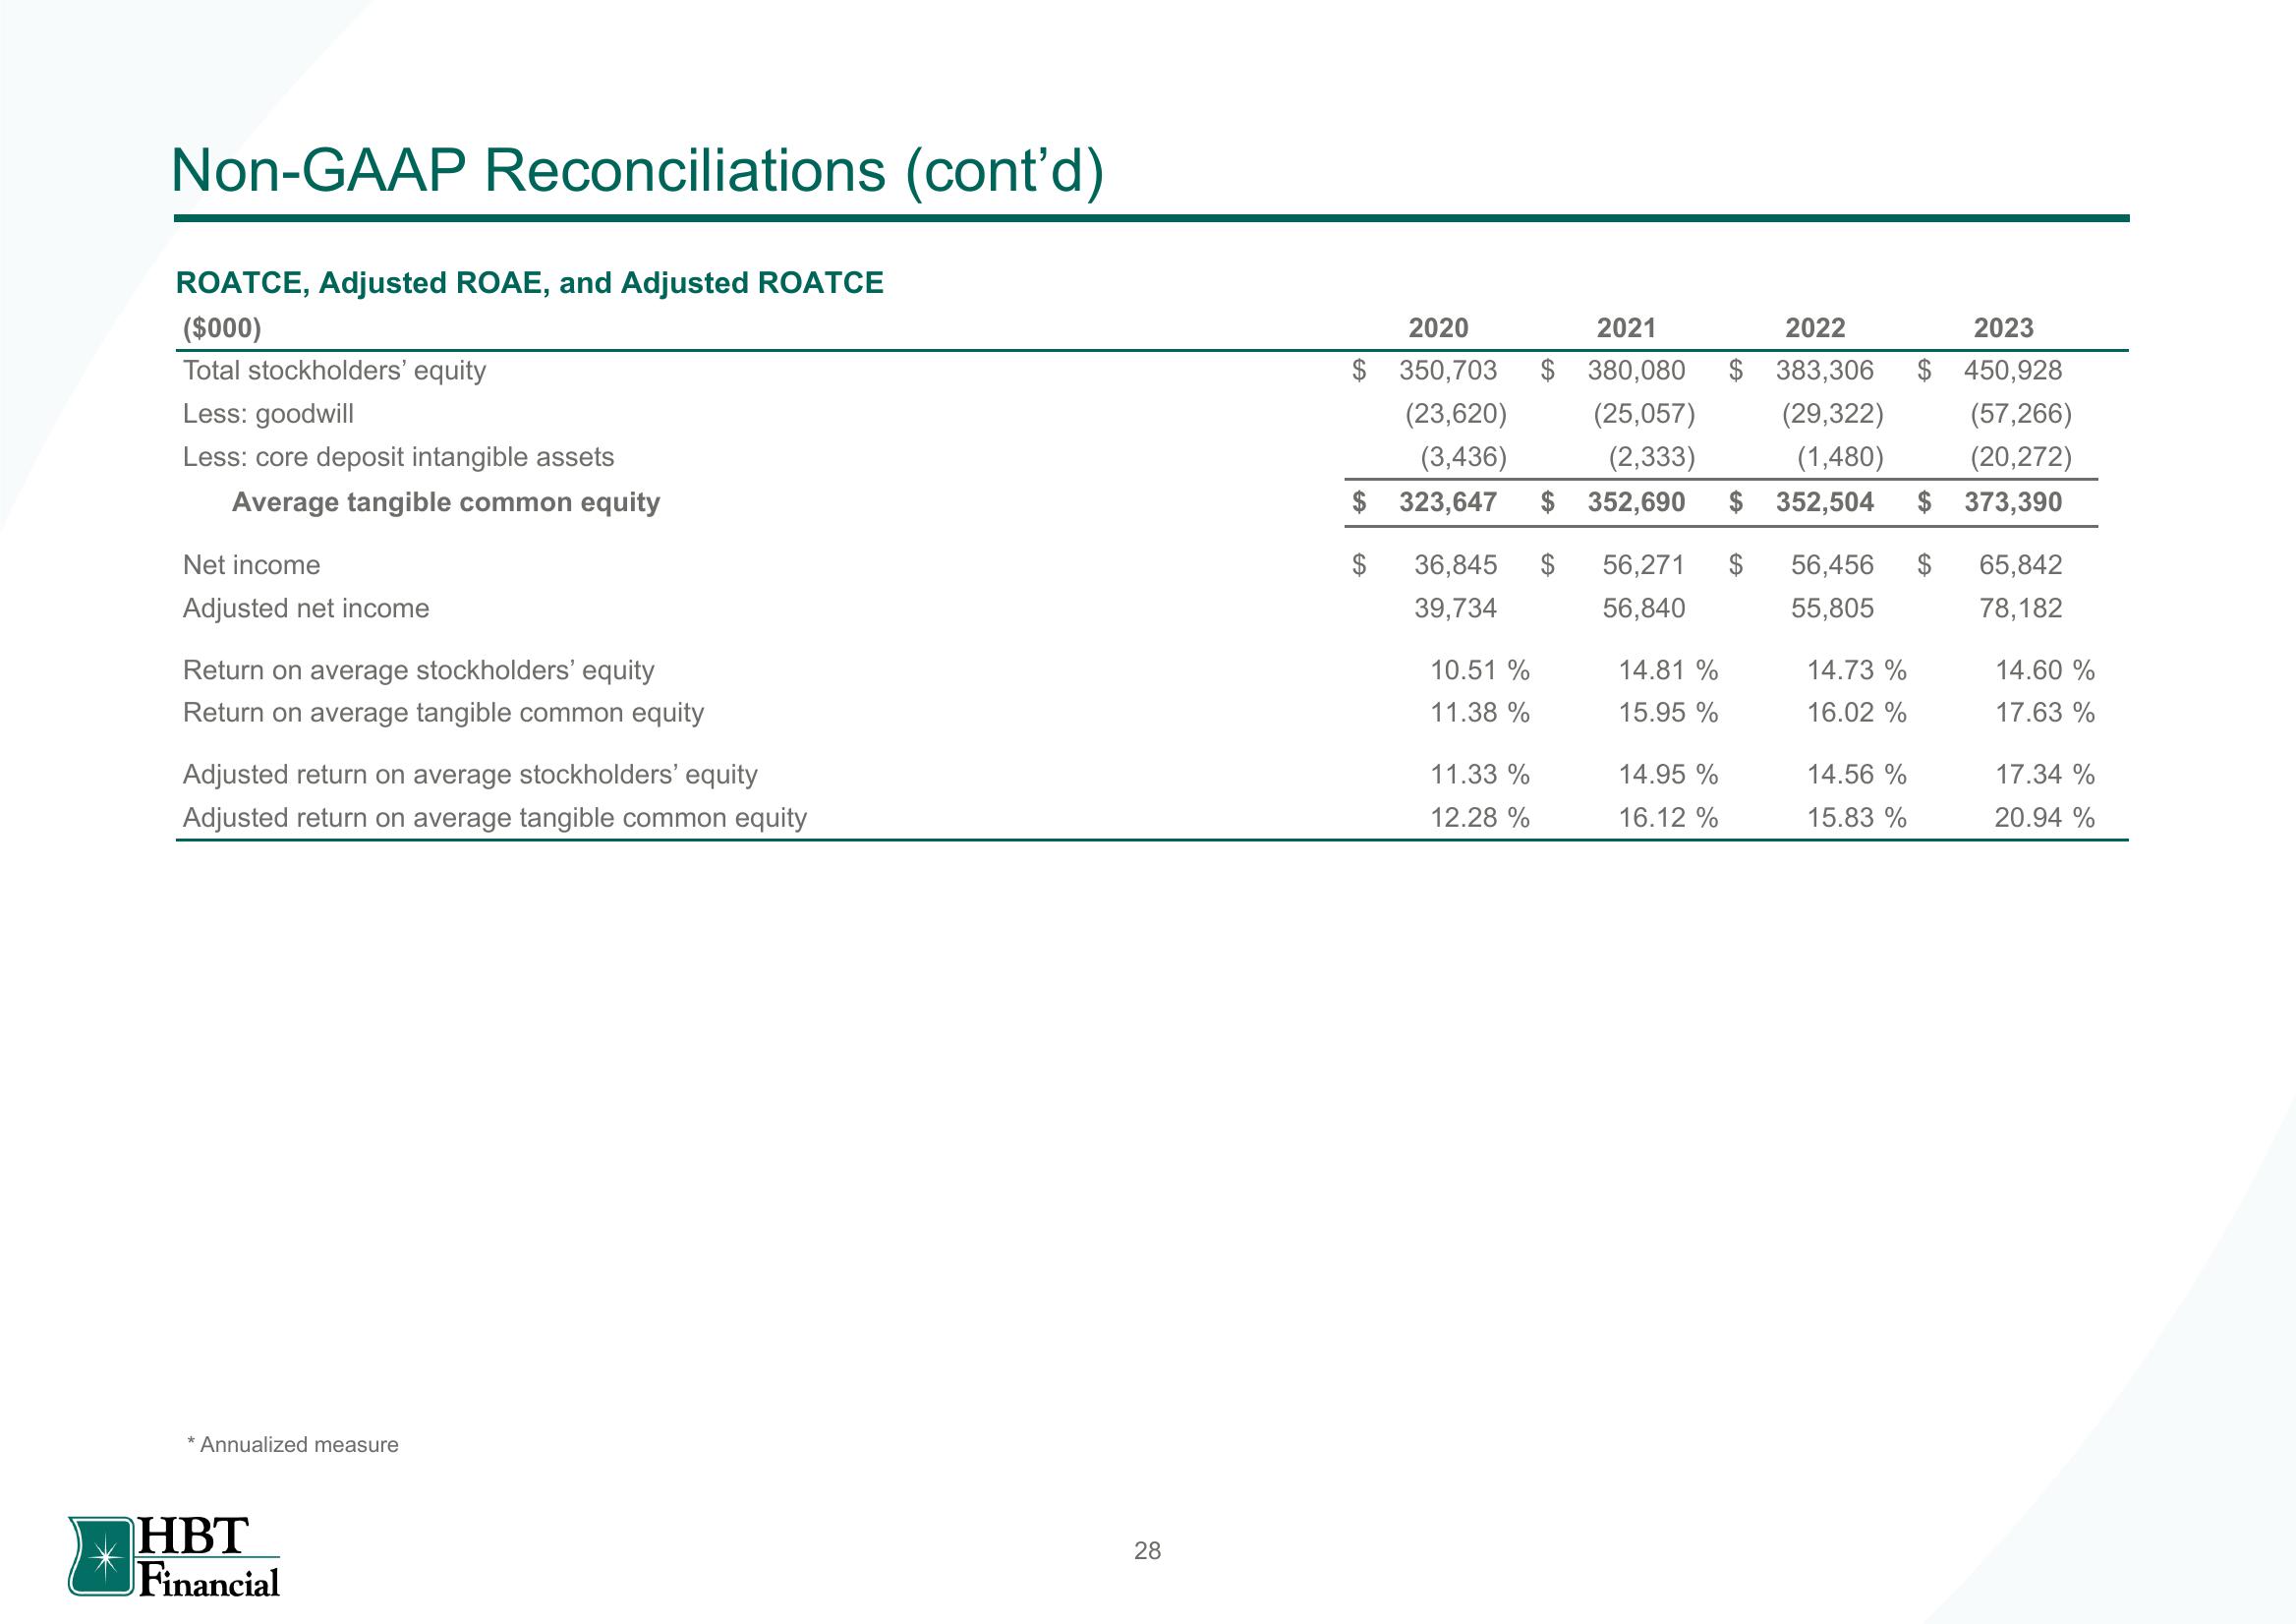
Non-GAAP Reconciliations (cont'd)
ROATCE, Adjusted ROAE, and Adjusted ROATCE
($000)
Total stockholders' equity
Less: goodwill
Less: core deposit intangible assets
Average tangible common equity
Net income
Adjusted net income
Return on average stockholders' equity
Return on average tangible common equity
Adjusted return on average stockholders' equity
Adjusted return on average tangible common equity
* Annualized measure
HBT
Financial
28
2020
$ 350,703
(23,620) (25,057)
(3,436) (2,333)
323,647 $ 352,690
$
$
36,845
39,734
10.51 %
11.38 %
2021
2022
2023
$ 380,080 $ 383,306 $ 450,928
(29,322)
(1,480)
$ 352,504
(57,266)
(20,272)
$ 373,390
11.33 %
12.28 %
$ 56,271 $
56,840
14.81 %
15.95 %
14.95 %
16.12%
56,456 $
55,805
14.73 %
16.02 %
14.56 %
15.83 %
65,842
78,182
14.60 %
17.63 %
17.34 %
20.94 %View entire presentation