Dynatrace Results Presentation Deck
1)
2)
3)
4)
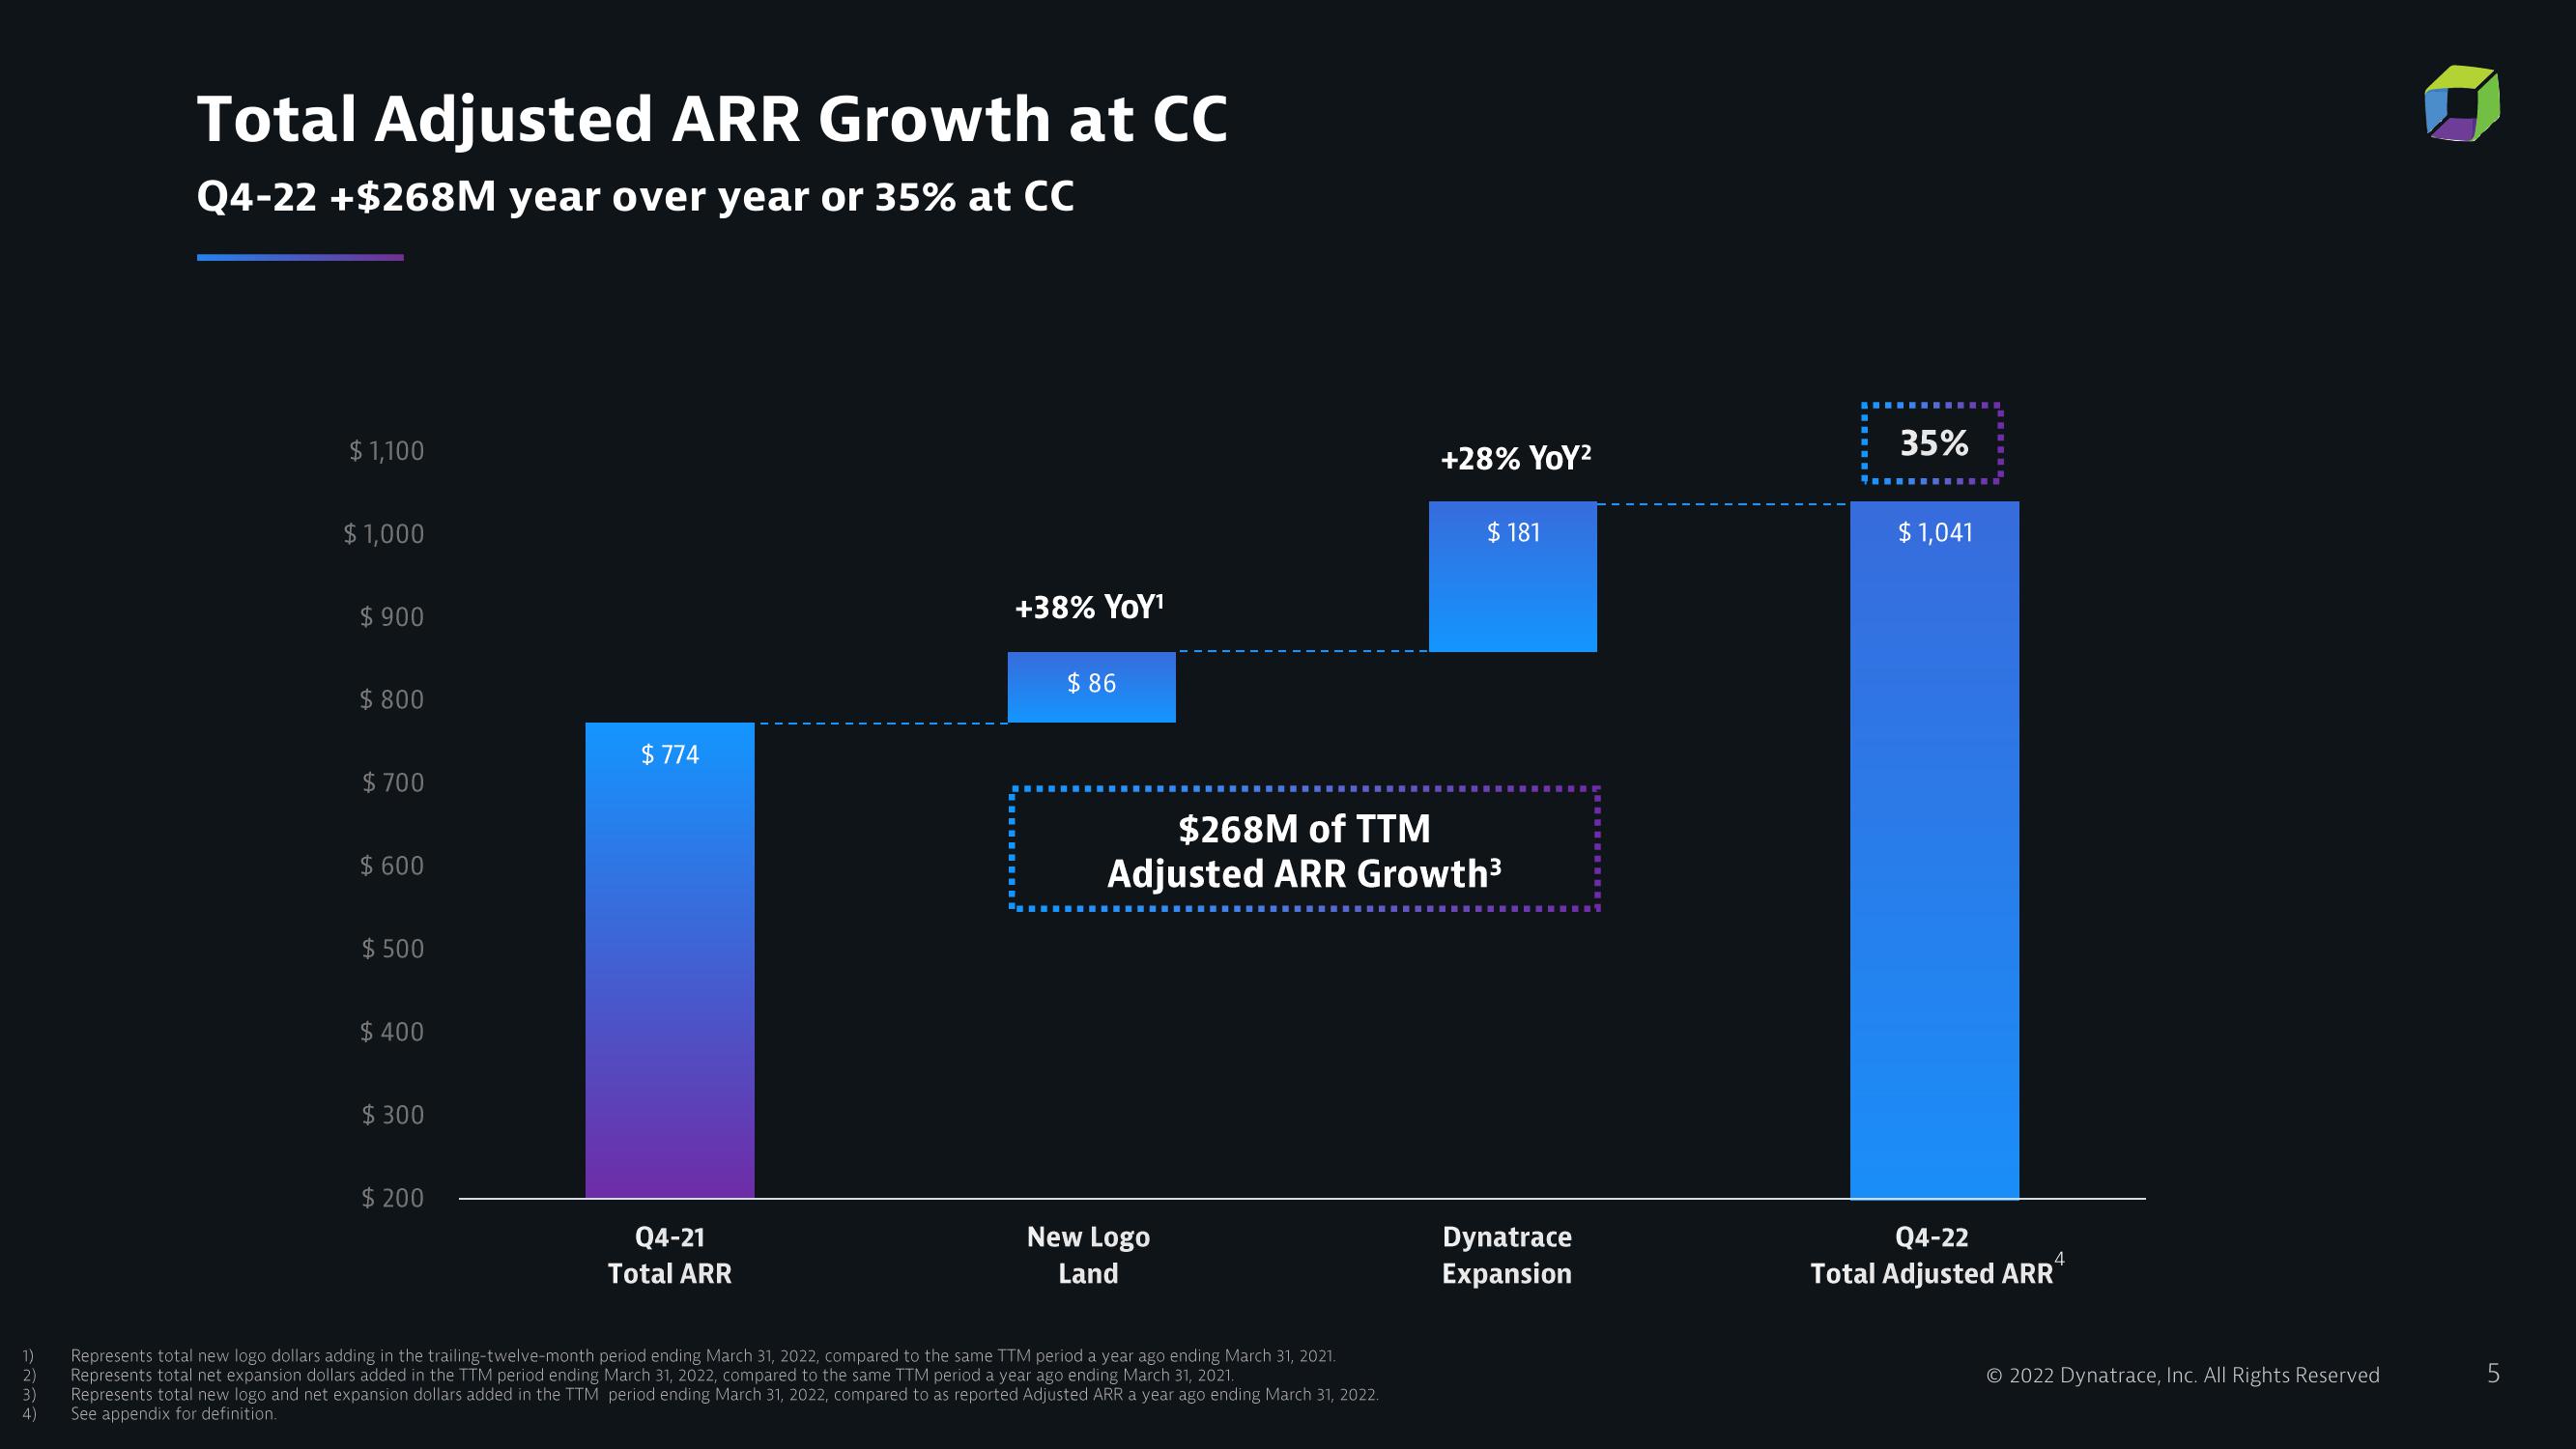
Total Adjusted ARR Growth at CC
Q4-22 +$268M year over year or 35% at CC
$1,100
$1,000
$ 900
$ 800
$ 700
$ 600
$ 500
$ 400
$300
$ 200
$774
Q4-21
Total ARR
+38% YOY¹
$86
‒‒‒‒‒‒‒‒‒‒‒‒‒‒‒‒‒‒‒‒‒‒‒
New Logo
Land
+28% YoY²
$268M of TTM
Adjusted ARR Growth³
Represents total new logo dollars adding in the trailing-twelve-month period ending March 31, 2022, compared to the same TTM period a year ago ending March 31, 2021.
Represents total net expansion dollars added in the TTM period ending March 31, 2022, compared to the same TTM period a year ago ending March 31, 2021.
Represents total new logo and net expansion dollars added in the TTM period ending March 31, 2022, compared to as reported Adjusted ARR a year ago ending March 31, 2022.
See appendix for definition.
$ 181
Dynatrace
Expansion
‒‒‒‒‒‒‒‒‒‒
35%
$1,041
Q4-22
4
Total Adjusted ARR
© 2022 Dynatrace, Inc. All Rights Reserved
LO
5View entire presentation