Informa Results Presentation Deck
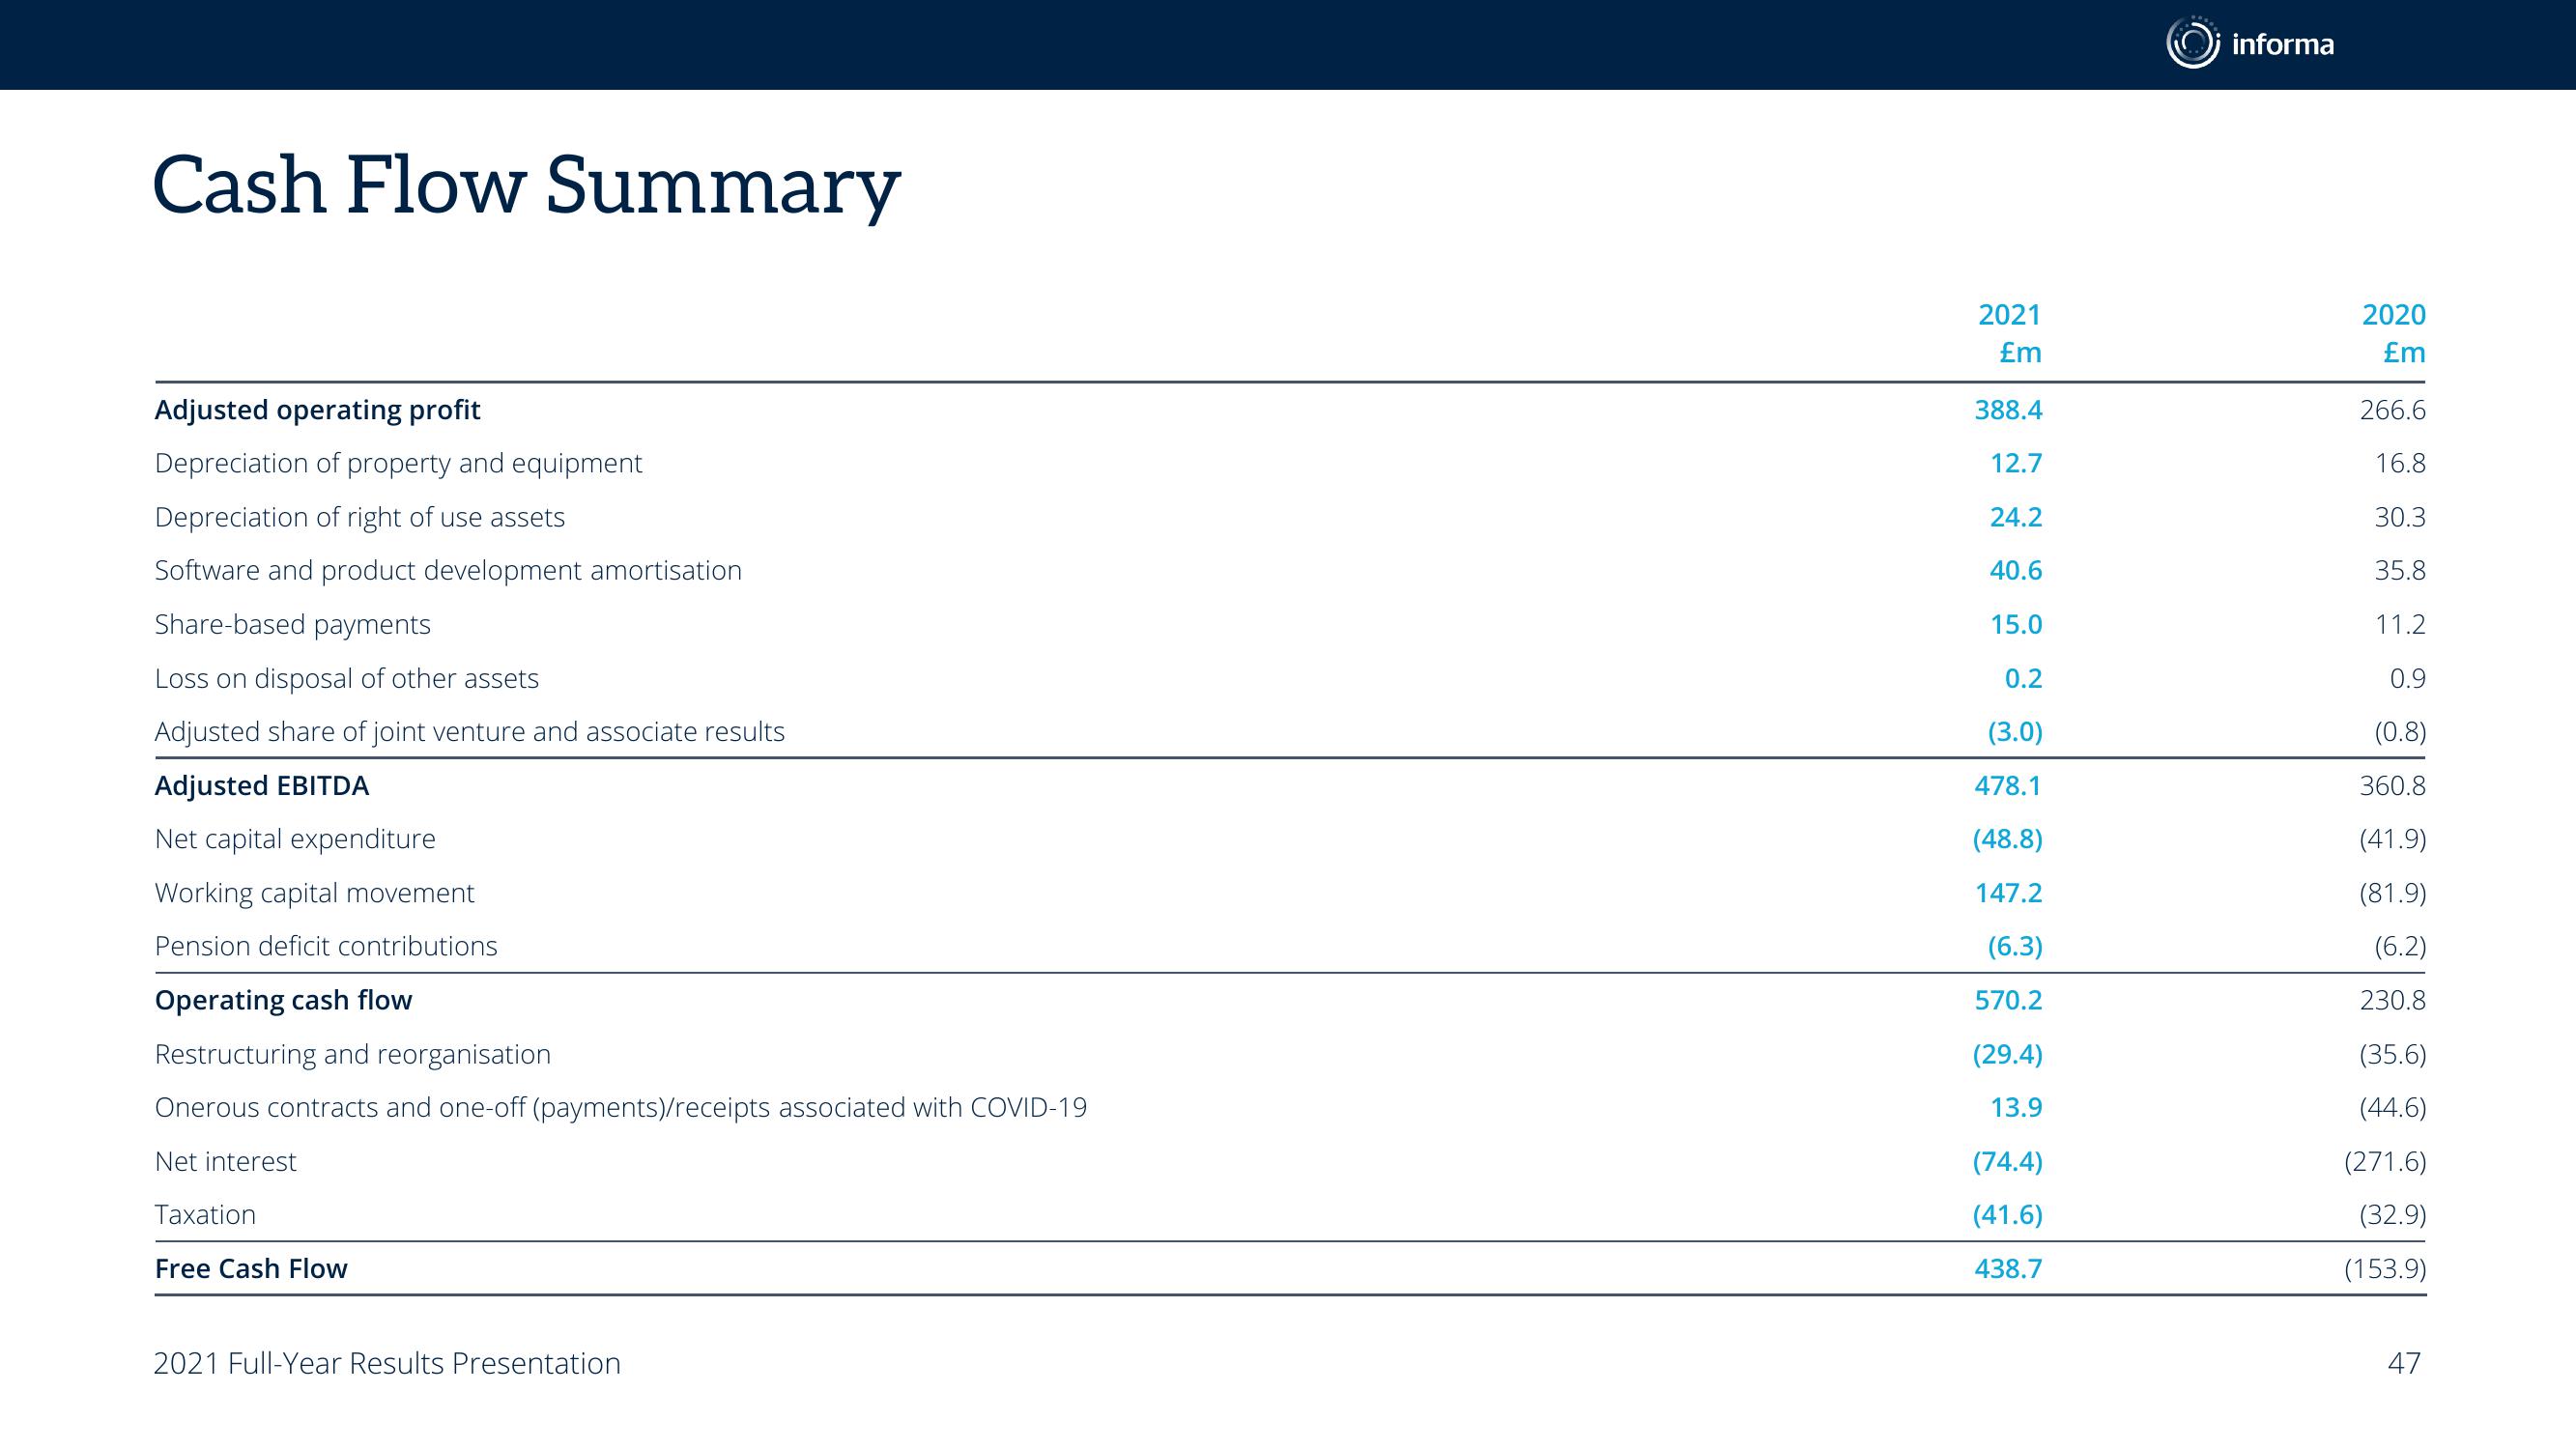
Cash Flow Summary
Adjusted operating profit
Depreciation of property and equipment
Depreciation of right of use assets
Software and product development amortisation
Share-based payments
Loss on disposal of other assets
Adjusted share of joint venture and associate results
Adjusted EBITDA
Net capital expenditure
Working capital movement
Pension deficit contributions
Operating cash flow
Restructuring and reorganisation
Onerous contracts and one-off (payments)/receipts associated with COVID-19
Net interest
Taxation
Free Cash Flow
2021 Full-Year Results Presentation
2021
£m
388.4
12.7
24.2
40.6
15.0
0.2
(3.0)
478.1
(48.8)
147.2
(6.3)
570.2
(29.4)
13.9
(74.4)
(41.6)
438.7
informa
2020
£m
266.6
16.8
30.3
35.8
11.2
0.9
(0.8)
360.8
(41.9)
(81.9)
(6.2)
230.8
(35.6)
(44.6)
(271.6)
(32.9)
(153.9)
47View entire presentation