Dynatrace Results Presentation Deck
1)
2)
3)
Compelling Financial Profile
✓
G
S
Rapid ARR
growth
Predictable
model
Healthy growth
dynamics
Investing for
growth, balancing
healthy margins
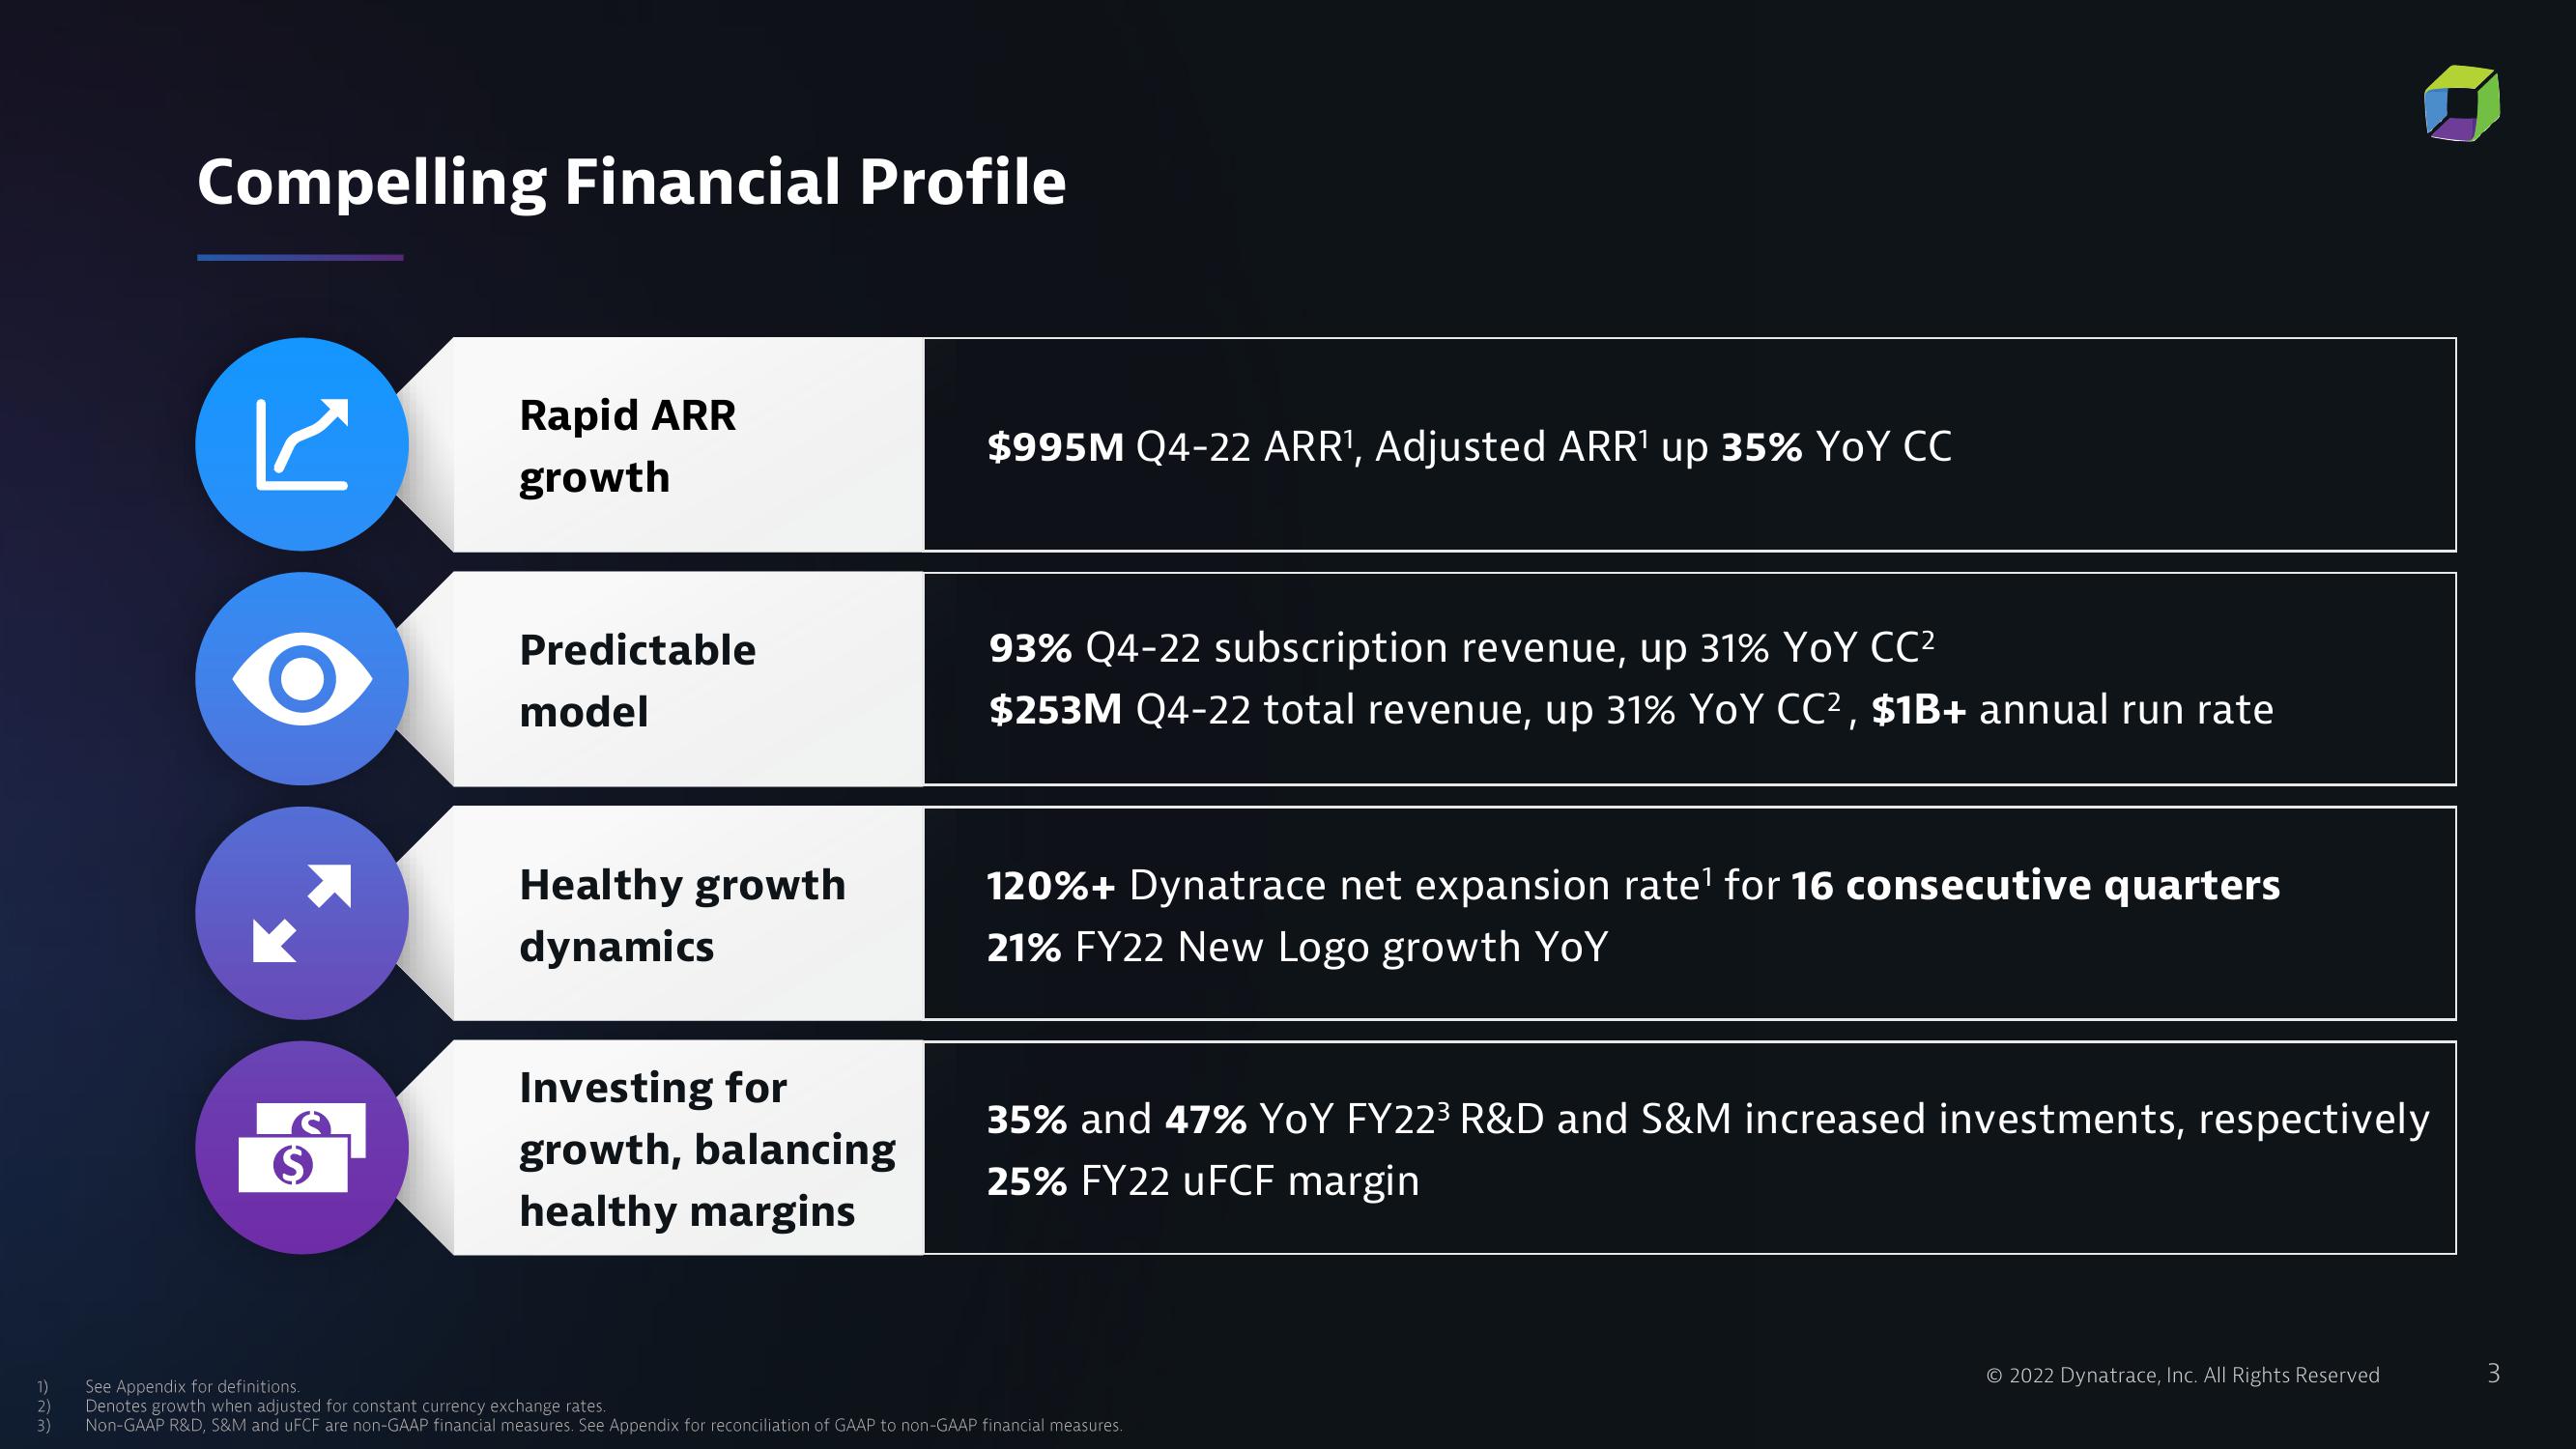
$995M Q4-22 ARR¹, Adjusted ARR¹ up 35% YoY CC
93% Q4-22 subscription revenue, up 31% YoY CC²
$253M Q4-22 total revenue, up 31% YoY CC², $1B+ annual run rate
120%+ Dynatrace net expansion rate¹ for 16 consecutive quarters
21% FY22 New Logo growth YoY
35% and 47% YoY FY22³ R&D and S&M increased investments, respectively
25% FY22 uFCF margin
See Appendix for definitions.
Denotes growth when adjusted for constant currency exchange rates.
Non-GAAP R&D, S&M and uFCF are non-GAAP financial measures. See Appendix for reconciliation of GAAP to non-GAAP financial measures.
© 2022 Dynatrace, Inc. All Rights Reserved
3View entire presentation