Snap Inc Results Presentation Deck
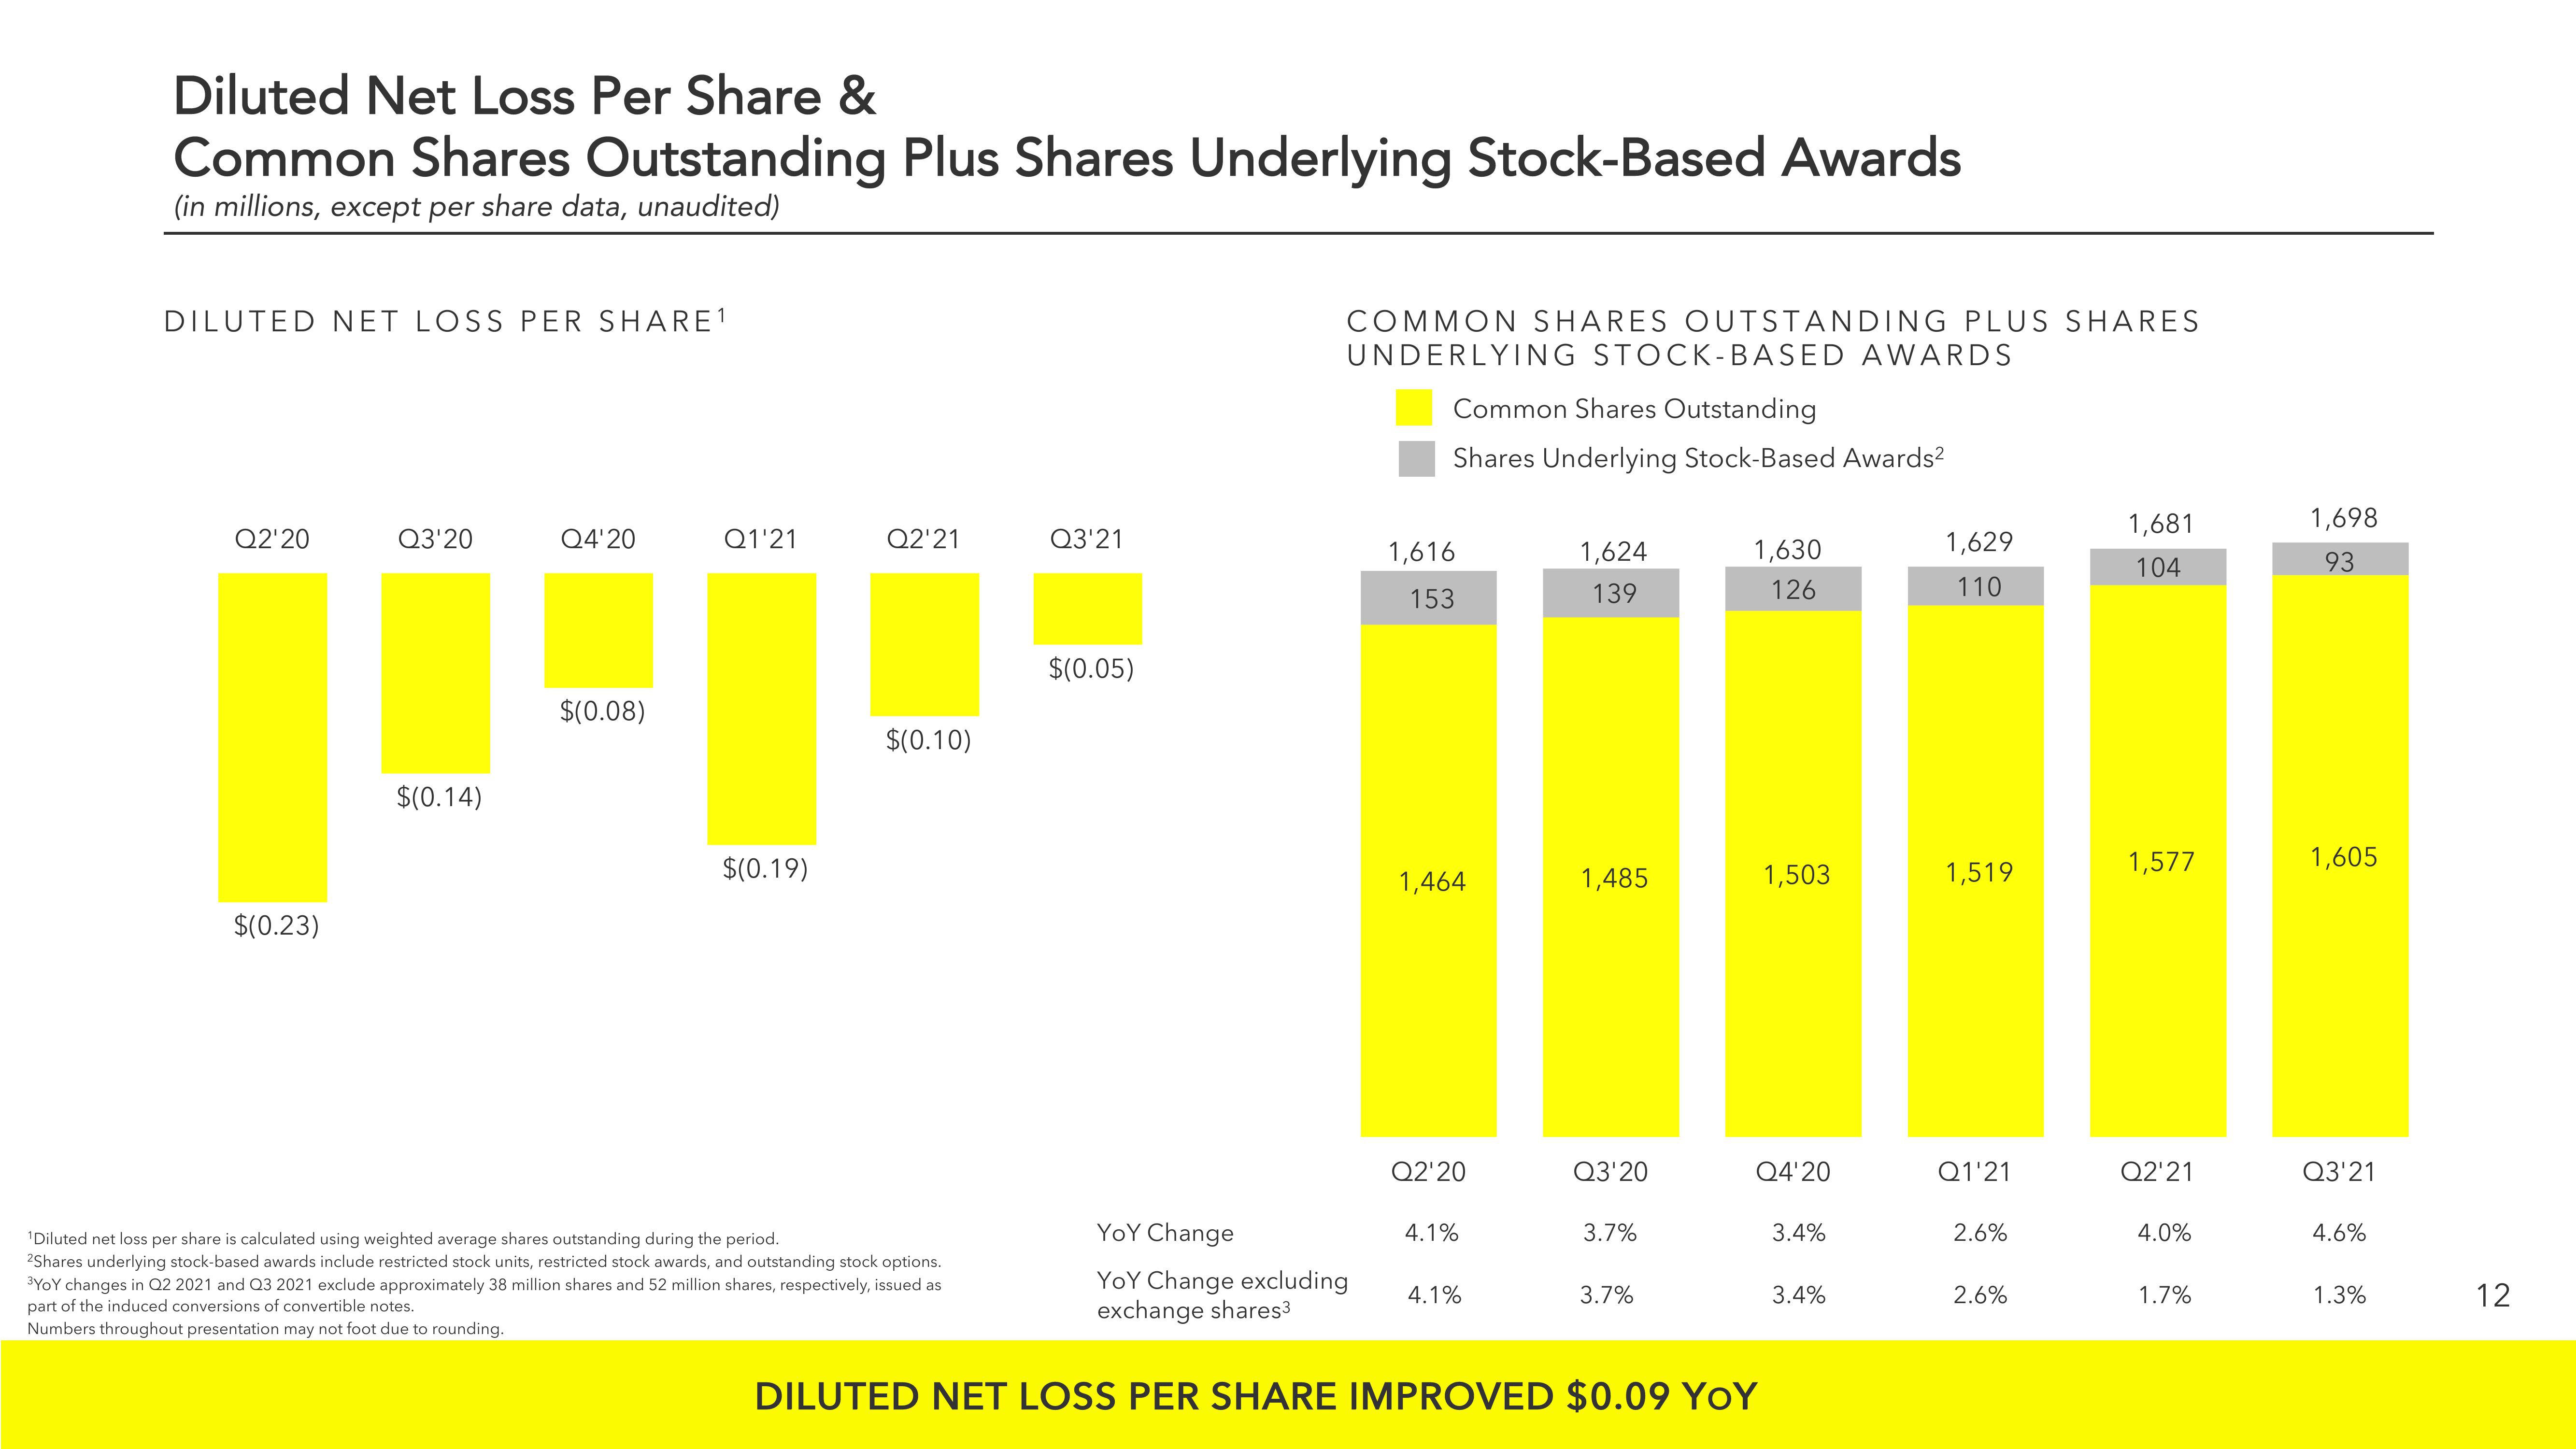
Diluted Net Loss Per Share &
Common Shares Outstanding Plus Shares Underlying Stock-Based Awards
(in millions, except per share data, unaudited)
DILUTED NET LOSS PER SHARE ¹
Q2'20
$(0.23)
Q3'20
$(0.14)
Q4'20
$(0.08)
Q1'21
$(0.19)
Q2'21
$(0.10)
Q3'21
¹Diluted net loss per share is calculated using weighted average shares outstanding during the period.
2Shares underlying stock-based awards include restricted stock units, restricted stock awards, and outstanding stock options.
³YOY changes in Q2 2021 and Q3 2021 exclude approximately 38 million shares and 52 million shares, respectively, issued as
part of the induced conversions of convertible notes.
Numbers throughout presentation may not foot due to rounding.
$(0.05)
COMMON SHARES OUTSTANDING PLUS SHARES
UNDERLYING STOCK-BASED AWARDS
Common Shares Outstanding
Shares Underlying Stock-Based Awards²
1,616
153
1,464
Q2'20
4.1%
1,624
139
4.1%
1,485
Q3'20
YOY Change
YOY Change excluding
exchange shares3
DILUTED NET LOSS PER SHARE IMPROVED $0.09 YOY
3.7%
1,630
126
3.7%
1,503
Q4'20
3.4%
3.4%
1,629
110
1,519
Q1'21
2.6%
2.6%
1,681
104
1,577
Q2'21
4.0%
1.7%
1,698
93
1,605
Q3'21
4.6%
1.3%
12View entire presentation