BMO Capital Markets Investment Banking Pitch Book
BMO Capital Markets
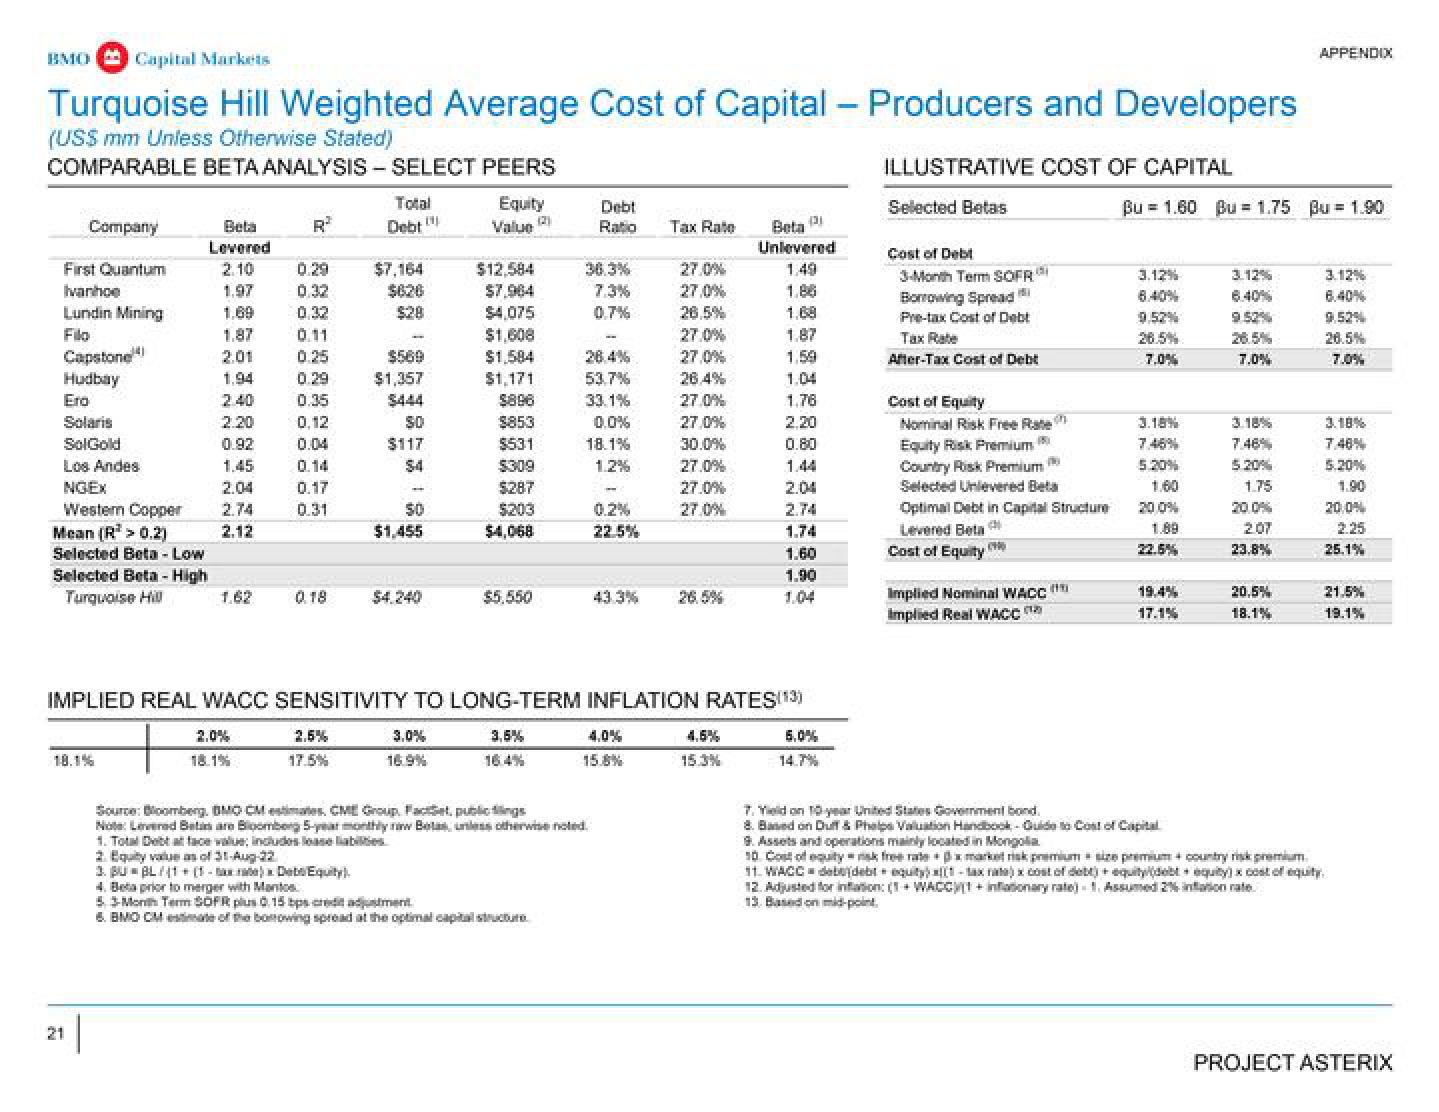
Turquoise Hill Weighted Average Cost of Capital - Producers and Developers
(USS mm Unless Otherwise Stated)
COMPARABLE BETA ANALYSIS SELECT PEERS
Company
First Quantum
Ivanhoe
Lundin Mining
Filo
Capstone
Hudbay
Ero
Solaris
SolGold
Los Andes
NGEX
Western Copper
Mean (R² > 0.2)
Selected Beta - Low
Selected Beta - High
Turquoise Hill
18.1%
21
Beta
Levered
2.10
1.97
1.69
1.87
2.01
1,94
2.40
2.20
0.92
1.45
2.04
2.12
1.62
R²
2.0%
18.1%
0.29
0.32
0.32
0.11
0.25
0.29
0.35
0.12
0.04
0.14
0.17
0.31
0.18
Total
Debt
2.5%
17.5%
$7,164
$626
$28
$569
$1,357
$117
$4
50
$1,455
$4.240
Equity
Value (2)
16.9%
$12,584
$7.964
$4,075
$1,608
$1,584
$1,171
$896
$853
$531
$309
$287
$203
$4,068
$5.550
Debt
Ratio
36.3%
7.3%
0.7%
26.4%
53.7%
33.1%
0.0%
18.1%
1.2%
0.2%
22.5%
Source: Bloomberg, BMO CM estimates, CME Group. Facet, publicis
Note: Levered Bets are Bloomberg 5-year monthly raw Botas, unless otherwise noted.
selbs
1. Total Debatface value; includes
2. Equity value as of 31-Aug-22
3. Bu=BL/(1+(1-x)Dete Equity
4. Bet prior to merger with Mantos
53-Month Term SOFR plus 0.15 bps credit adjustment
6. BMC CMate of the borrowing spread at the optimal capital structure
15.8%
Tax Rate
27.0%
27,0%
26,5%
IMPLIED REAL WACC SENSITIVITY TO LONG-TERM INFLATION RATES(13)
3.5%
27.0%
27,0%
26.4%
27.0%
27,0%
30.0%
27.0%
27.0%
27.0%
pi
Beta
Unlevered
4.6%
15.3%
1.86
1,68
1.87
1.59
1.04
1.76
2.20
0.80
1.44
2.04
2.74
1.74
1.60
1.90
1.04
5.0%
ILLUSTRATIVE COST OF CAPITAL
Selected Betas
Cost of Debt
3-Month Term SOFR
Borrowing Spread
Pre-tax Cost of Debt
Tax Rate
After-Tax Cost of Debt
Cost of Equity
Nominal Risk Free Rate
Equity Risk Premium
Country Risk Premium
Selected Unlevered Beta
Optimal Debt in Capital Structure
Levered Beta
Cost of Equity
Implied Nominal WACC
Implied Real WACC
Bu = 1.60 Bu = 1.75 Bu = 1.90
3.12%
6.40%
9.52%
7.0%
3.18%
7.46%
5.20%
1.60
20 0%
1.89
22.5%
17.1%
7. Yield on 10 year United States Government bond
8. Based on Duff & Phelps Valuation Handbook-Quide to Cost of Capital
3.12%
6.40%
9.52%
26.5%
7.0%
3.18%
7.46%
5.20%
1.75
20.0%
2.07
23.8%
APPENDIX
20.5%
18.1%
3.12%
9.52%
26.5%
3.18%
7.48%
5.20%
20,0%
2.25
25.1%
21.5%
19.1%
9. Assets and operations mainly located in Mongolia
10 Cost of equity nsk free ratexmarket risk premium size premium + country risk premium
11. WACC= debujdebt equity)(1-tax rata) x cost of debt)equity(debt equity) x cost of equity.
12. Adjusted for inflation: (+WACC)(1+inflationary rate) 1. Assumed 2% inflation rate.
13. Based on mid-point.
PROJECT ASTERIXView entire presentation