Azek Investor Presentation Deck
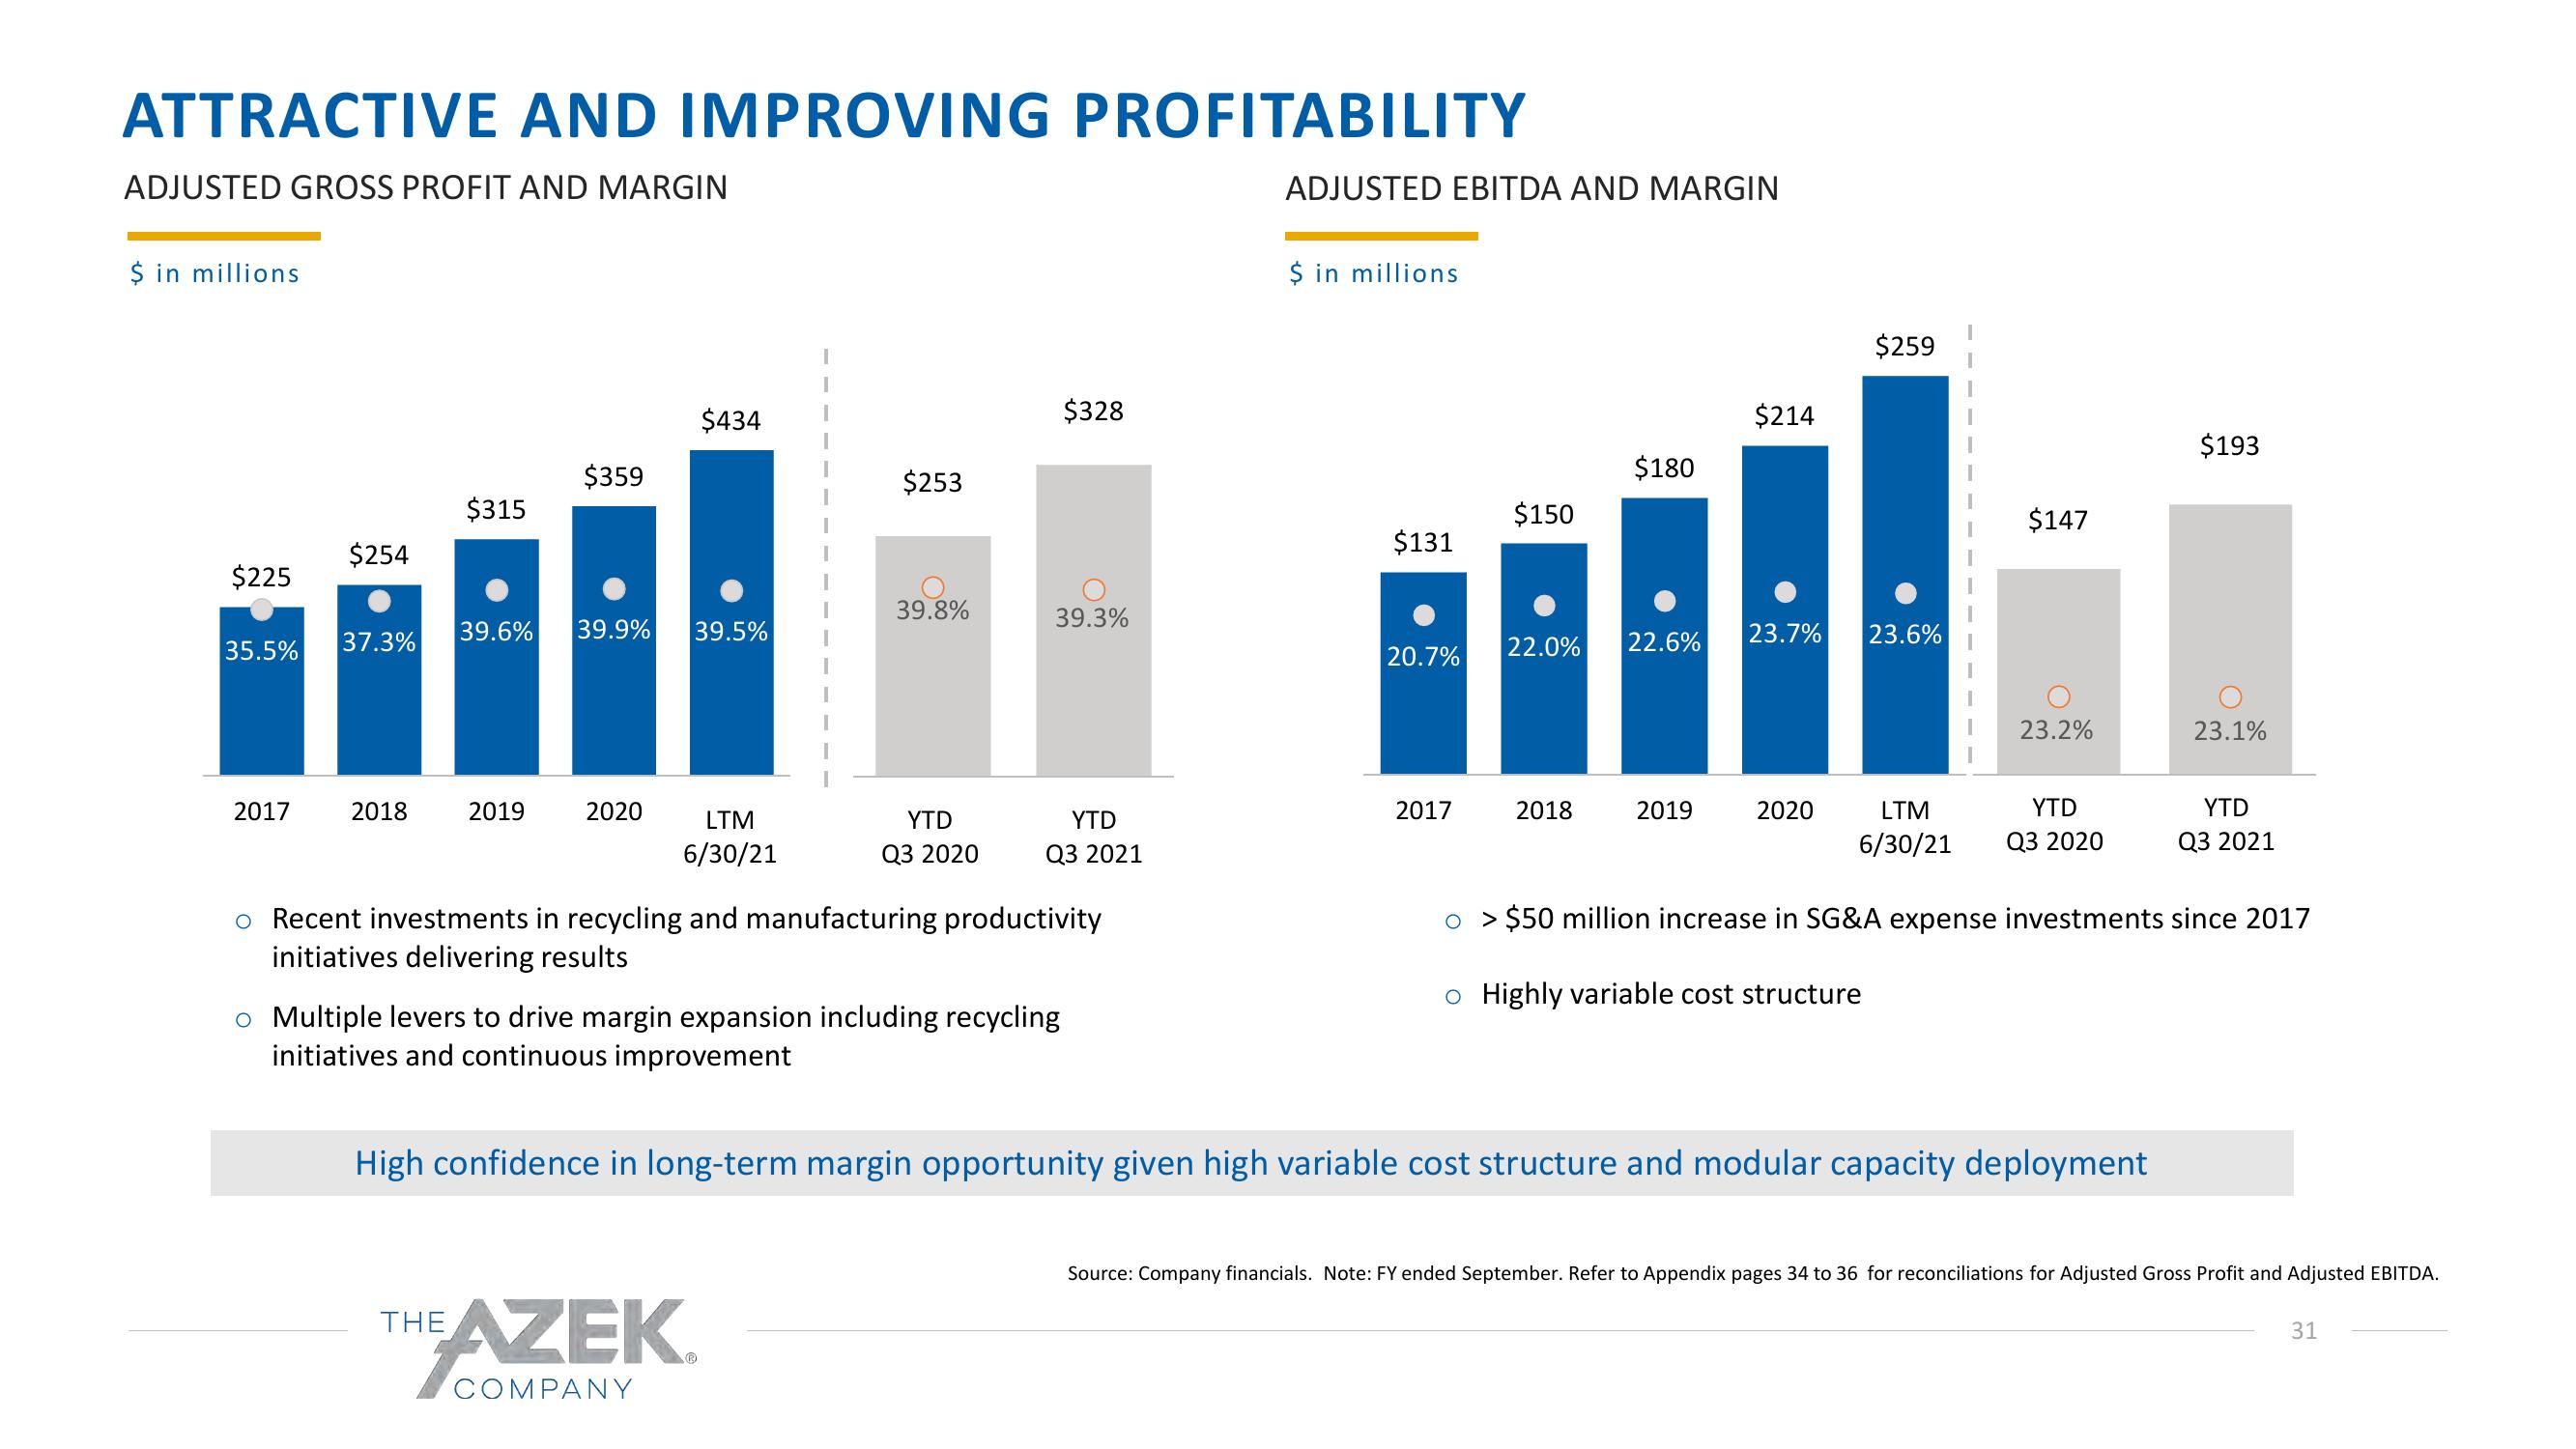
ATTRACTIVE AND IMPROVING PROFITABILITY
ADJUSTED GROSS PROFIT AND MARGIN
$ in millions
$225
35.5%
2017
$254
37.3%
2018
$315
$359
2019
39.6% 39.9% 39.5%
2020
$434
LTM
6/30/21
$253
39.8%
THE AZEK.
COMPANY
YTD
Q3 2020
$328
39.3%
YTD
Q3 2021
o Recent investments in recycling and manufacturing productivity
initiatives delivering results
o Multiple levers to drive margin expansion including recycling
initiatives and continuous improvement
ADJUSTED EBITDA AND MARGIN
$ in millions
$131
20.7%
2017
$150
22.0%
2018
$180
22.6%
2019
$214
23.7%
2020
$259
23.6%
LTM
6/30/21
$147
23.2%
YTD
Q3 2020
High confidence in long-term margin opportunity given high variable cost structure and modular capacity deployment
$193
23.1%
YTD
Q3 2021
> $50 million increase in SG&A expense investments since 2017
o Highly variable cost structure
Source: Company financials. Note: FY ended September. Refer to Appendix pages 34 to 36 for reconciliations for Adjusted Gross Profit and Adjusted EBITDA.
31View entire presentation