OpenText Investor Presentation Deck
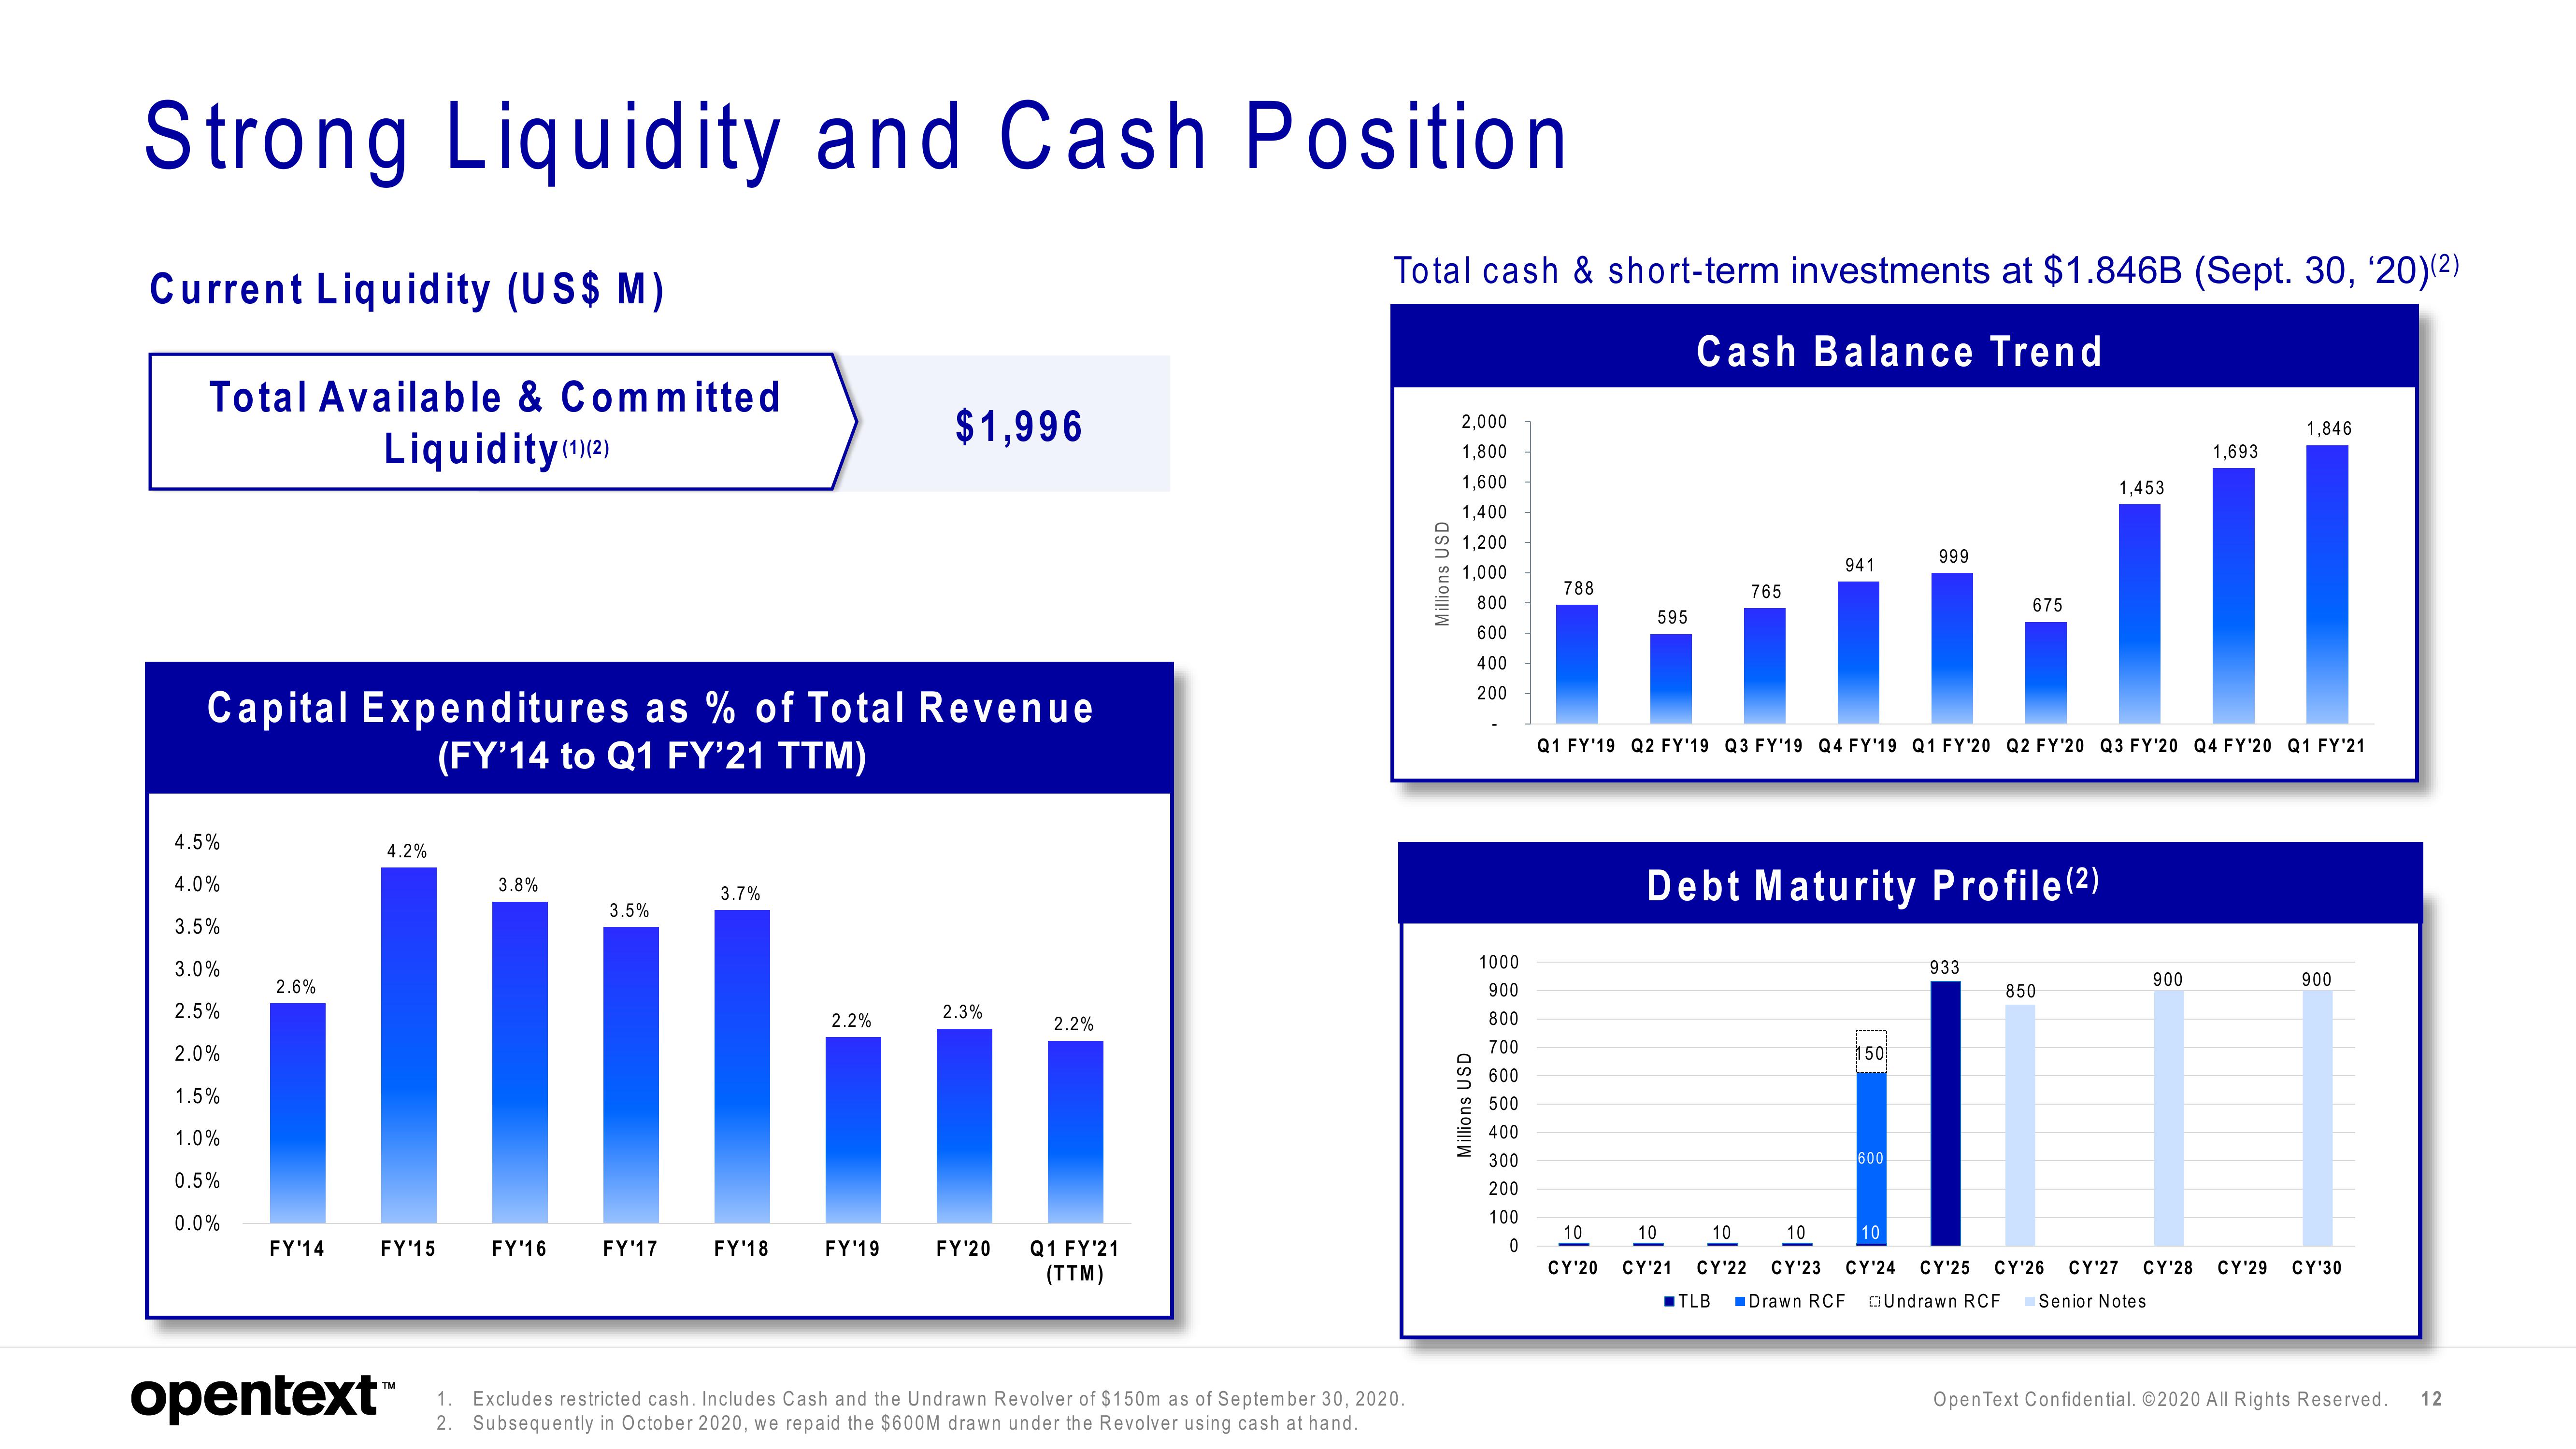
Strong Liquidity and Cash Position
Current Liquidity (US$ M)
Total Available & Committed
Liquidity (¹)(2)
Capital Expenditures as % of Total Revenue
(FY'14 to Q1 FY'21 TTM)
4.5%
4.0%
3.5%
3.0%
2.5%
2.0%
1.5%
1.0%
0.5%
0.0%
2.6%
FY'14
4.2%
FY'15
opentext™
3.8%
FY'16
3.5%
FY'17
3.7%
FY'18
2.2%
$1,996
FY'19
2.3%
FY'20
2.2%
Q1 FY'21
(TTM)
Total cash & short-term investments at $1.846B (Sept. 30, '20)(²)
Cash Balance Trend
1. Excludes restricted cash. Includes Cash and the Undrawn Revolver of $150m as of September 30, 2020.
2. Subsequently in October 2020, we repaid the $600M drawn under the Revolver using cash at hand.
Millions USD
2,000
1,800
1,600
1,400
1,200
1,000
800
600
400
200
Millions USD
1000
900
800
700
600
500
400
300
200
100
0
788
595
10
CY'20
765
Ï
941
10 10
CY'21 CY'22
■TLB
Debt Maturity Profile (²)
150
999
Q1 FY'19 Q2 FY'19 Q3 FY'19 Q4 FY'19 Q1 FY'20 Q2 FY'20 Q3 FY'20 Q4 FY'20 Q1 FY'21
600
10 10
CY'23 CY'24
Drawn RCF
675
933
CY'25
Undrawn RCF
1,453
850
1,693
900
CY'26 CY'27 CY'28 CY'29
Senior Notes
1,846
900
CY'30
Open Text Confidential. ©2020 All Rights Reserved. 12View entire presentation