WeWork Investor Presentation Deck
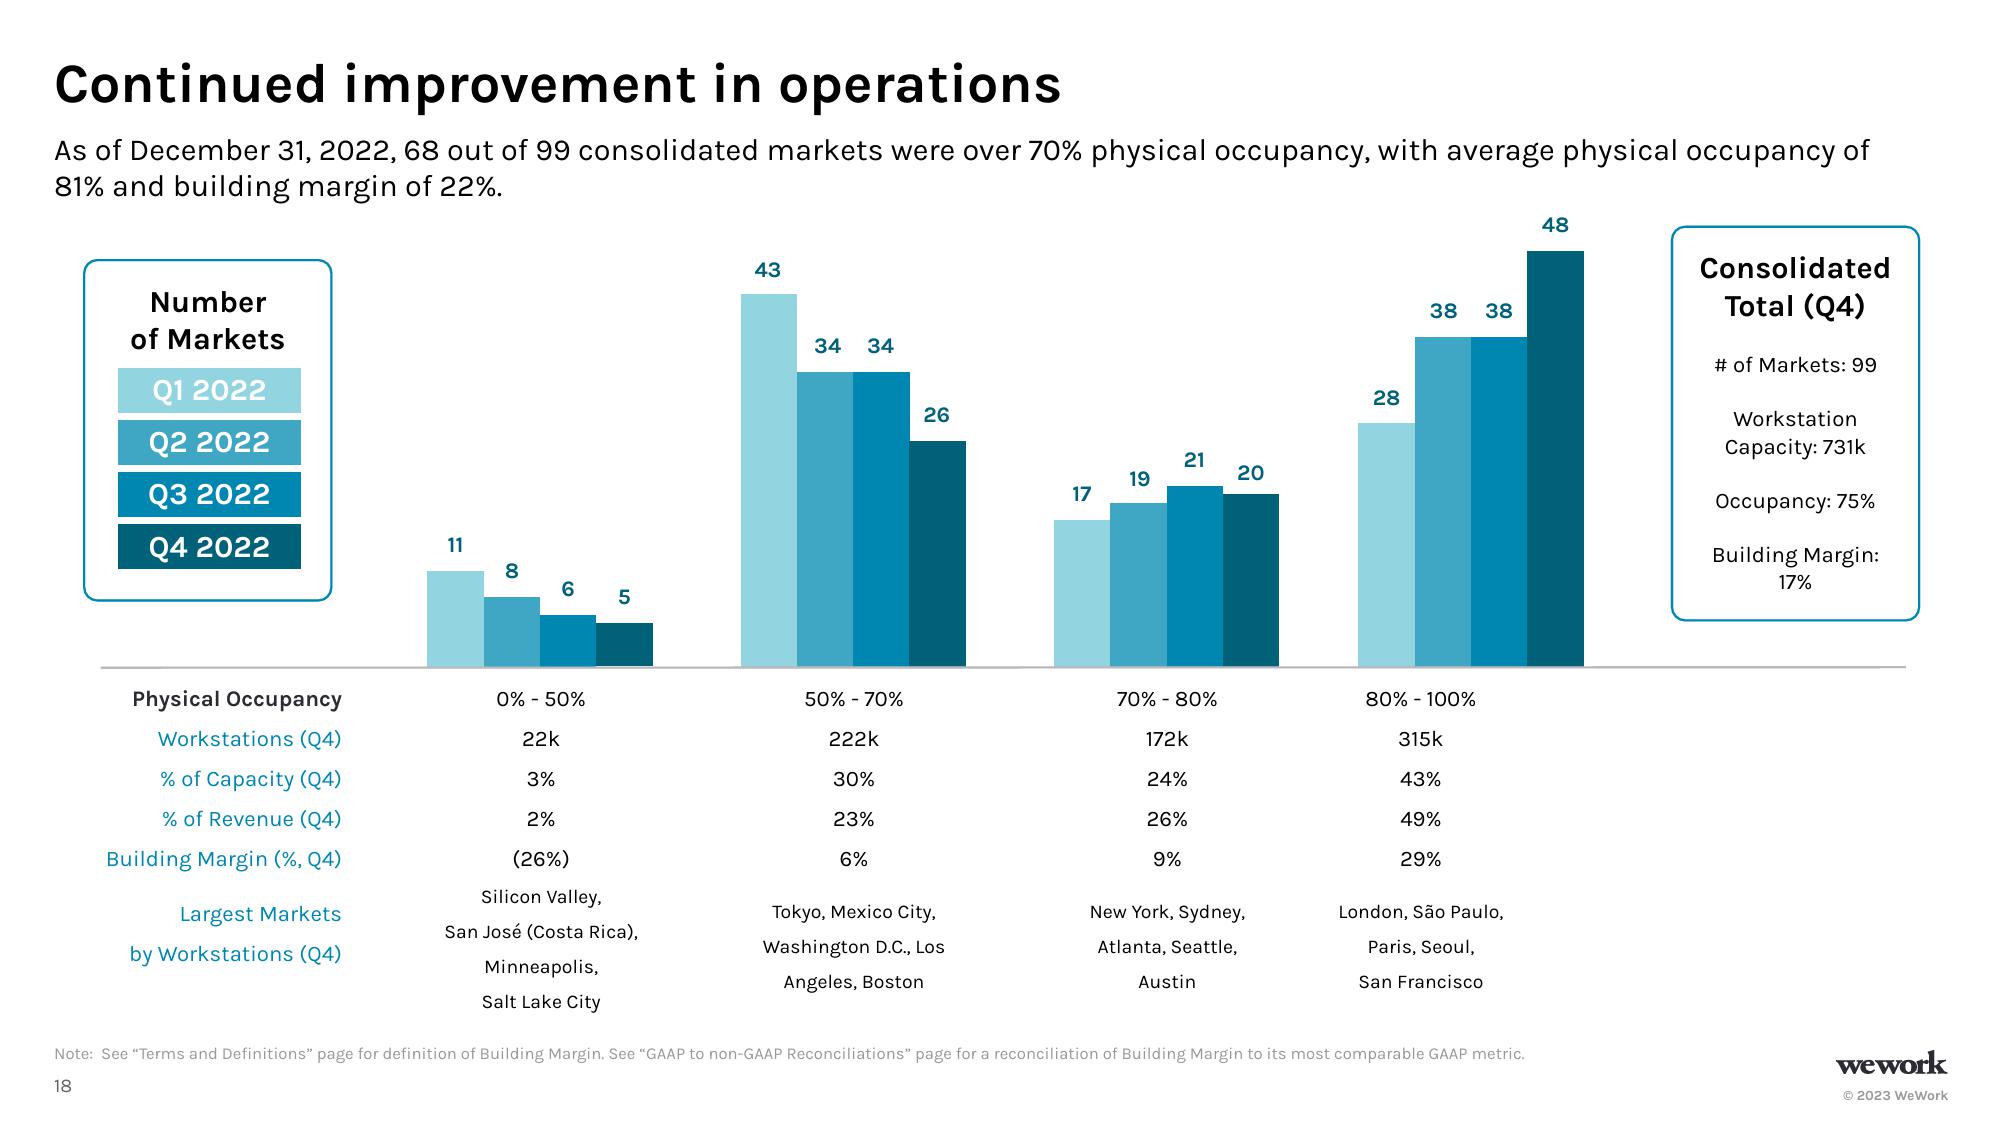
Continued improvement in operations
As of December 31, 2022, 68 out of 99 consolidated markets were over 70% physical occupancy, with average physical occupancy of
81% and building margin of 22%.
Number
of Markets
Q1 2022
Q2 2022
Q3 2022
Q4 2022
Physical Occupancy
Workstations (Q4)
% of Capacity (Q4)
% of Revenue (Q4)
Building Margin (%, Q4)
Largest Markets
by Workstations (Q4)
11
8
65
0% - 50%
22k
3%
2%
(26%)
Silicon Valley,
San José (Costa Rica),
Minneapolis,
Salt Lake City
43
34 34
50% - 70%
222k
30%
23%
6%
26
Tokyo, Mexico City,
Washington D.C., Los
Angeles, Boston
17
19
21
70% - 80%
172k
24%
26%
9%
20
New York, Sydney,
Atlanta, Seattle,
Austin
28
38 38
80% - 100%
315k
43%
49%
29%
London, São Paulo,
Paris, Seoul,
San Francisco
Note: See "Terms and Definitions" page for definition of Building Margin. See "GAAP to non-GAAP Reconciliations" page for a reconciliation of Building Margin to its most comparable GAAP metric.
18
48
Consolidated
Total (Q4)
# of Markets: 99
Workstation
Capacity: 731k
Occupancy: 75%
Building Margin:
17%
wework
© 2023 WeWorkView entire presentation