Corecentric Investor Presentation Deck
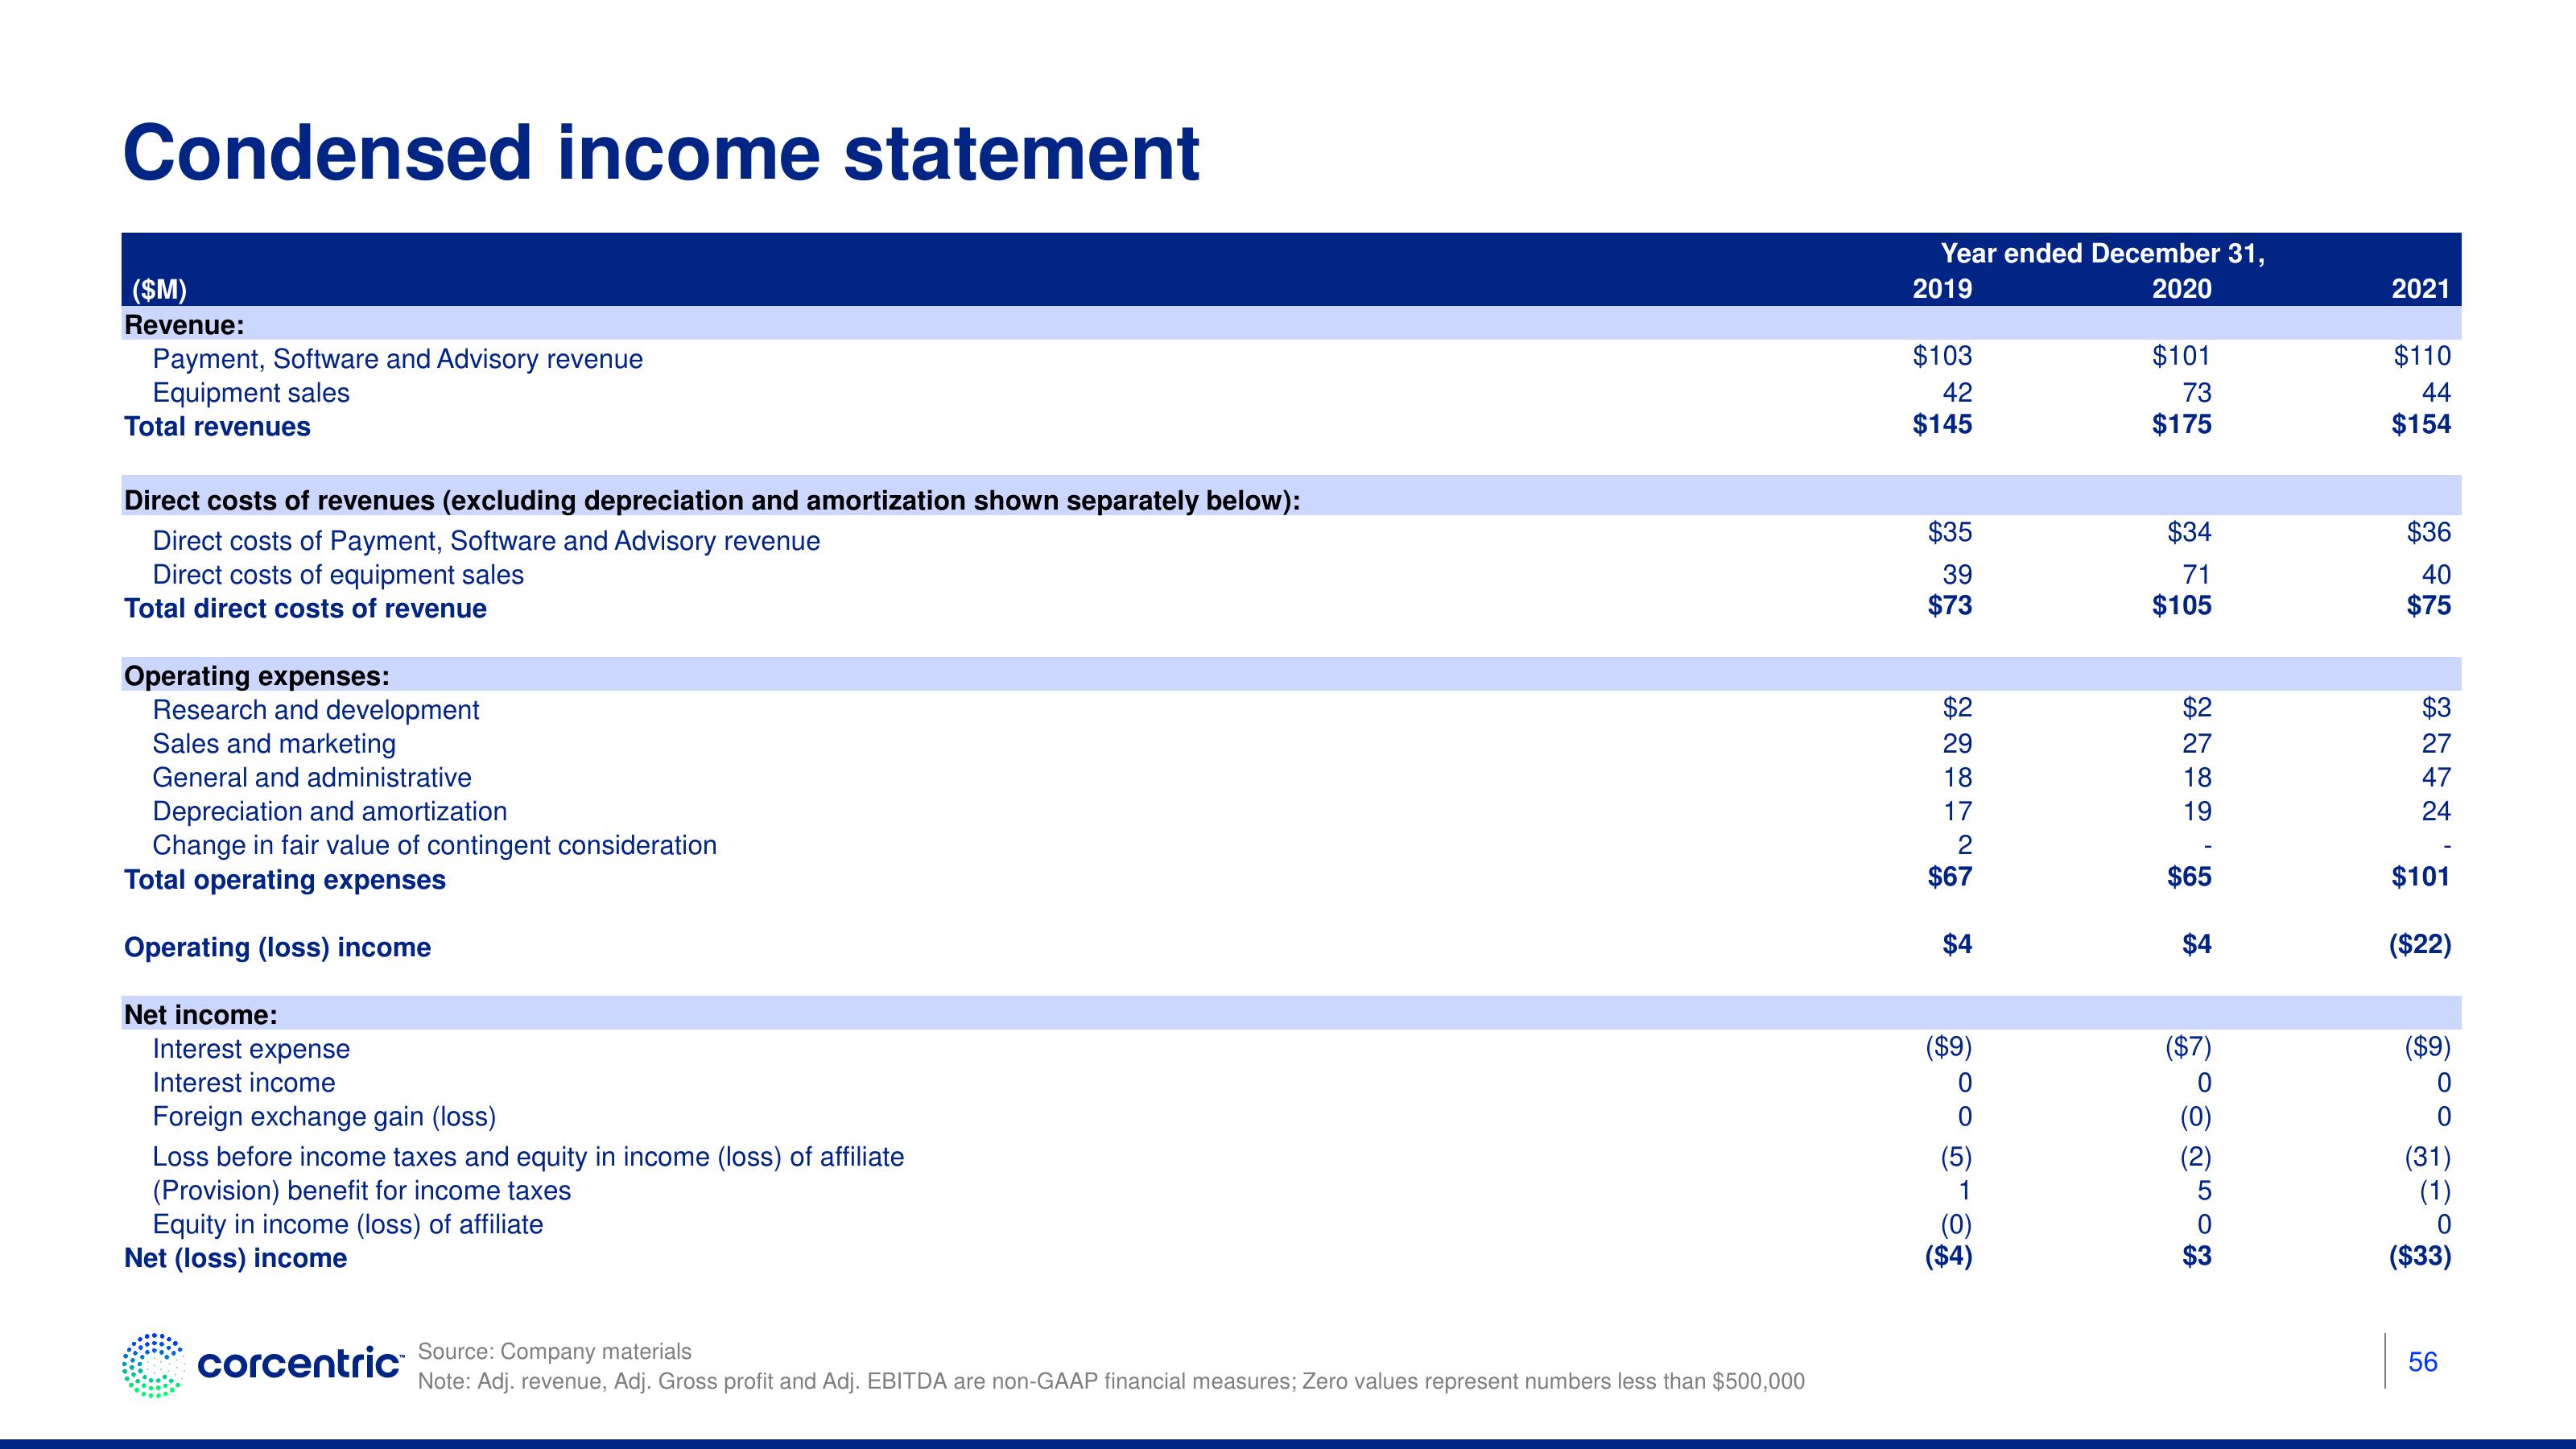
Condensed income statement
($M)
Revenue:
Payment, Software and Advisory revenue
Equipment sales
Total revenues
Direct costs of revenues (excluding depreciation and amortization shown separately below):
Direct costs of Payment, Software and Advisory revenue
Direct costs of equipment sales
Total direct costs of revenue
Operating expenses:
Research and development
Sales and marketing
General and administrative
Depreciation and amortization
Change in fair value of contingent consideration
Total operating expenses
Operating (loss) income
Net income:
Interest expense
Interest income
Foreign exchange gain (loss)
Loss before income taxes and equity in income (loss) of affiliate
(Provision) benefit for income taxes
Equity in income (loss) of affiliate
Net (loss) income
corcentric Source: Company materials
Note: Adj. revenue, Adj. Gross profit and Adj. EBITDA are non-GAAP financial measures; Zero values represent numbers less than $500,000
Year ended December 31,
2020
2019
$103
42
$145
$35
39
$73
$2
29
18
17
2
$67
$4
($9)
0
0
(5)
1
(0)
($4)
$101
73
$175
$34
71
$105
$2
27
18
19
$65
$4
($7)
0
(2)
5
2021
$110
44
$154
$36
40
$75
3242
$3
27
47
$101
($22)
($9)
0
0
(31)
(1)
0
($33)
56View entire presentation