Grab Results Presentation Deck
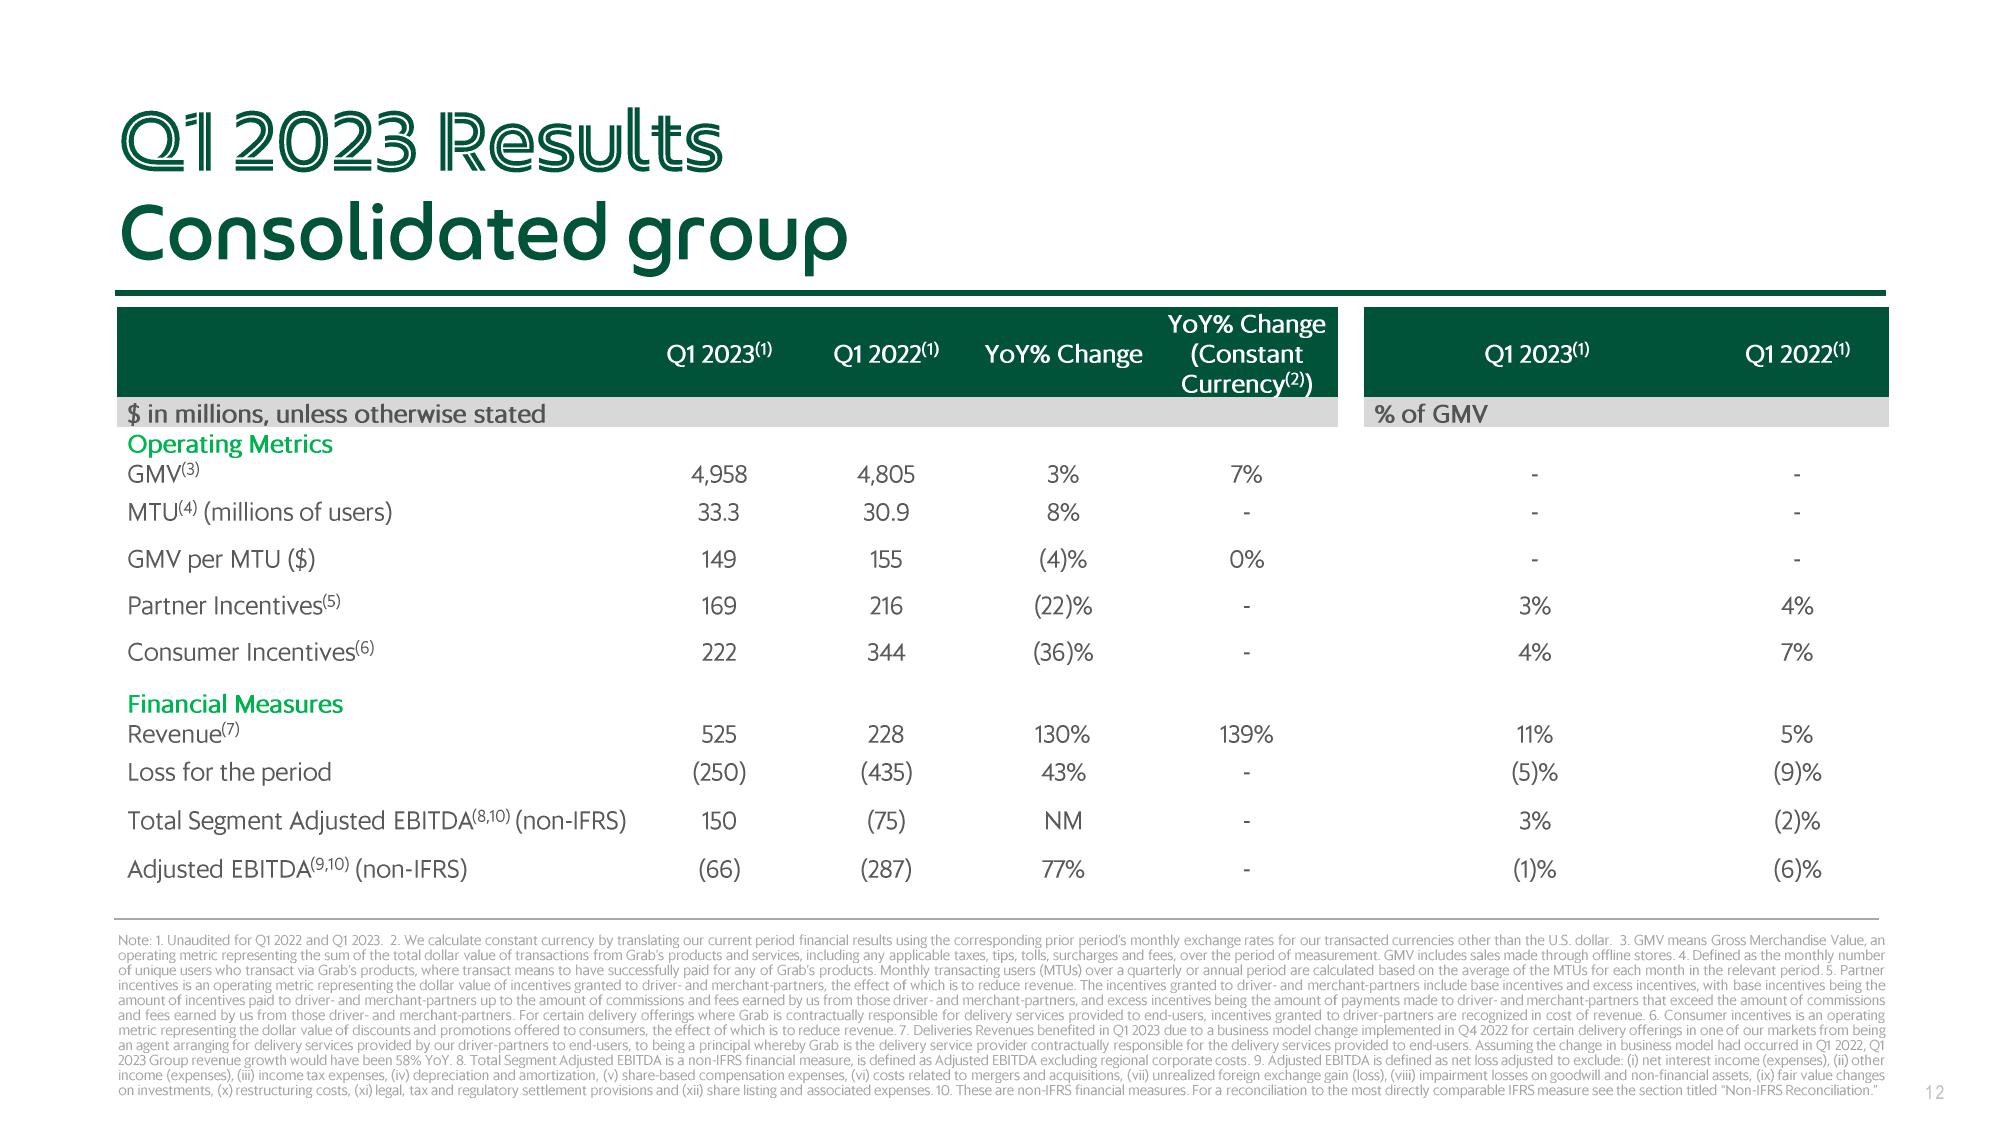
Q1 2023 Results
Consolidated group
$ in millions, unless otherwise stated
Operating Metrics
GMV(3)
MTU(4) (millions of users)
GMV per MTU ($)
Partner Incentives(5)
Consumer Incentives(6)
Financial Measures
Revenue(7)
Loss for the period
Total Segment Adjusted EBITDA(8,10) (non-IFRS)
Adjusted EBITDA(9,10) (non-IFRS)
Q1 2023(¹)
4,958
33.3
149
169
222
525
(250)
150
(66)
Q1 2022(1)
4,805
30.9
155
216
344
228
(435)
(75)
(287)
YOY% Change
3%
8%
(4)%
(22)%
(36)%
130%
43%
NM
77%
YOY% Change
(Constant
Currency(2))
7%
0%
139%
Q1 2023(1)
% of GMV
3%
4%
11%
(5)%
3%
(1)%
Q1 2022(1)
4%
7%
5%
(9)%
(2)%
(6)%
Note: 1. Unaudited for Q1 2022 and Q1 2023. 2. We calculate constant currency by translating our current period financial results using the corresponding prior period's monthly exchange rates for our transacted currencies other than the U.S. dollar. 3. GMV means Gross Merchandise Value, an
operating metric representing the sum of the total dollar value of transactions from Grab's products and services, including any applicable taxes, tips, tolls, surcharges and fees, over the period of measurement GMV includes sales made through offline stores. 4. Defined as the monthly number
of unique users who transact via Grab's products, where transact means to have successfully paid for any of Grab's products. Monthly transacting users (MTUS) over a quarterly or annual period are calculated based on the average of the MTUs for each month in the relevant period. 5. Partner
incentives is an operating metric representing the dollar value of incentives granted to driver- and merchant-partners, the effect of which is to reduce revenue. The incentives granted to driver- and merchant-partners include base incentives and excess incentives, with base incentives being the
amount of incentives paid to driver- and merchant-partners up to the amount of commissions and fees earned by us from those driver-and merchant-partners, and excess incentives being the amount of payments made to driver- and merchant-partners that exceed the amount of commissions
and fees earned by us from those driver- and merchant-partners. For certain delivery offerings where Grab is contractually responsible for delivery services provided to end-users, incentives granted to driver-partners are recognized in cost of revenue. 6. Consumer incentives is an operating
metric representing the dollar value of discounts and promotions offered to consumers, the effect of which is to reduce revenue. 7. Deliveries Revenues benefited in Q1 2023 due to a business model change implemented in Q4 2022 for certain delivery offerings in one of our markets from being
an agent arranging for delivery services provided by our driver-partners to end-users, to being a principal whereby Grab is the delivery service provider contractually responsible for the delivery services provided to end-users. Assuming the change in business model had occurred in Q1 2022, Q1
2023 Group revenue growth would have been 58% YoY. 8. Total Segment Adjusted EBITDA is a non-IFRS financial measure, is defined as Adjusted EBITDA excluding regional corporate costs. 9. Adjusted EBITDA is defined as net loss adjusted to exclude: (i) net interest income (expenses), (ii) other
income (expenses), (iii) income tax expenses, (iv) depreciation and amortization, (v) share-based compensation expenses, (vi) costs related to mergers and acquisitions, (vii) unrealized foreign exchange gain (loss), (viii) impairment losses on goodwill and non-financial assets, (ix) fair value changes
on investments, (x) restructuring costs, (xi) legal, tax and regulatory settlement provisions and (xii) share listing and associated expenses. 10. These are non-IFRS financial measures. For a reconciliation to the most directly comparable IFRS measure see the section titled "Non-IFRS Reconciliation."
12View entire presentation