Truist Financial Corp Results Presentation Deck
Non-GAAP reconciliations
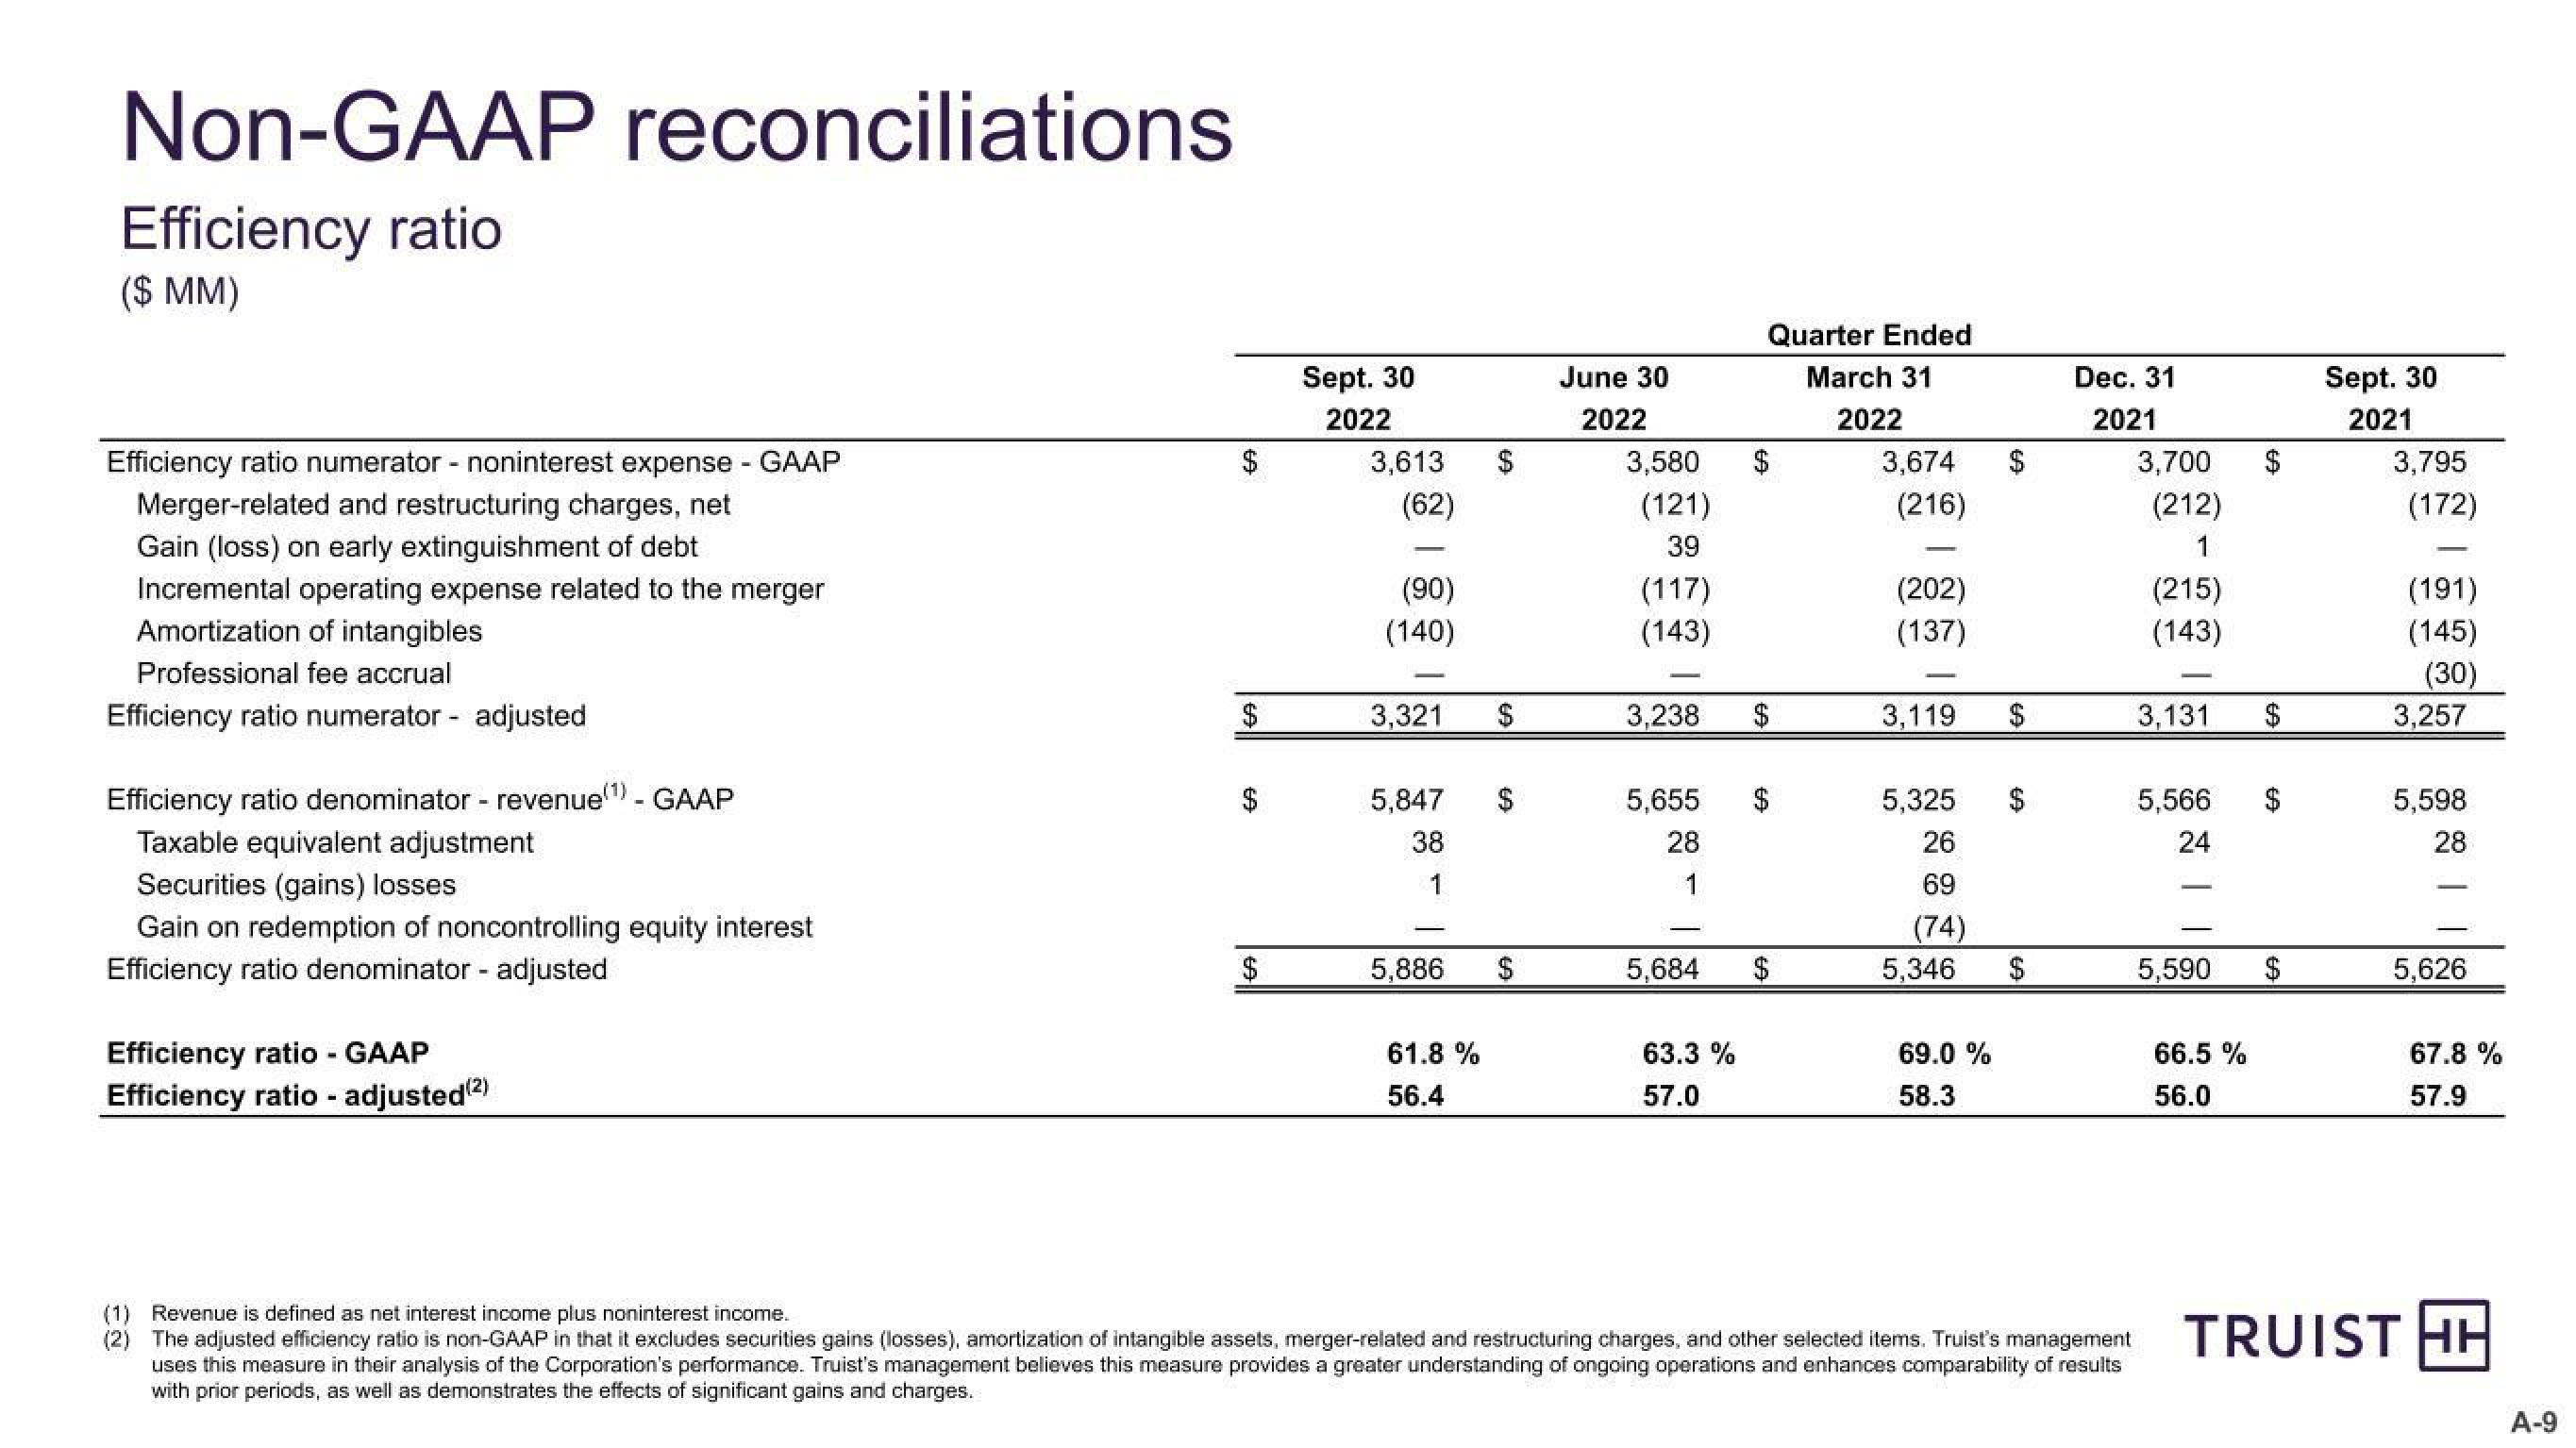
Efficiency ratio
($ MM)
Efficiency ratio numerator - noninterest expense - GAAP
Merger-related and restructuring charges, net
Gain (loss) on early extinguishment of debt
Incremental operating expense related to the merger
Amortization of intangibles
Professional fee accrual
Efficiency ratio numerator - adjusted
Efficiency ratio denominator - revenue(¹) - GAAP
(1)_
Taxable equivalent adjustment
Securities (gains) losses
Gain on redemption of noncontrolling equity interest
Efficiency ratio denominator - adjusted
Efficiency ratio - GAAP
Efficiency ratio - adjusted (2)
GA
$
69
$
Sept. 30
2022
3,613
(62)
(90)
(140)
3,321
5,847
38
1
5,886
61.8 %
56.4
June 30
2022
3,580
(121)
39
(117)
(143)
5,655
28
3,238 $
5,684
Quarter Ended
March 31
2022
63.3 %
57.0
$
$
3,674
(216)
(202)
(137)
3,119
5,325
26
69
(74)
5,346
69.0 %
58.3
$
Dec. 31
2021
(1) Revenue is defined as net interest income plus noninterest income.
(2) The adjusted efficiency ratio is non-GAAP in that it excludes securities gains (losses), amortization of intangible assets, merger-related and restructuring charges, and other selected items. Truist's management
uses this measure in their analysis of the Corporation's performance. Truist's management believes this measure provides a greater understanding of ongoing operations and enhances comparability of results
with prior periods, as well as demonstrates the effects of significant gains and charges.
3,700
(212)
1
(215)
(143)
3,131
5,566
24
5,590
66.5%
56.0
$
$
$
Sept. 30
2021
3,795
(172)
(191)
(145)
(30)
3,257
5,598
28
5,626
67.8 %
57.9
TRUIST HE
A-9View entire presentation