Kinnevik Results Presentation Deck
Intro
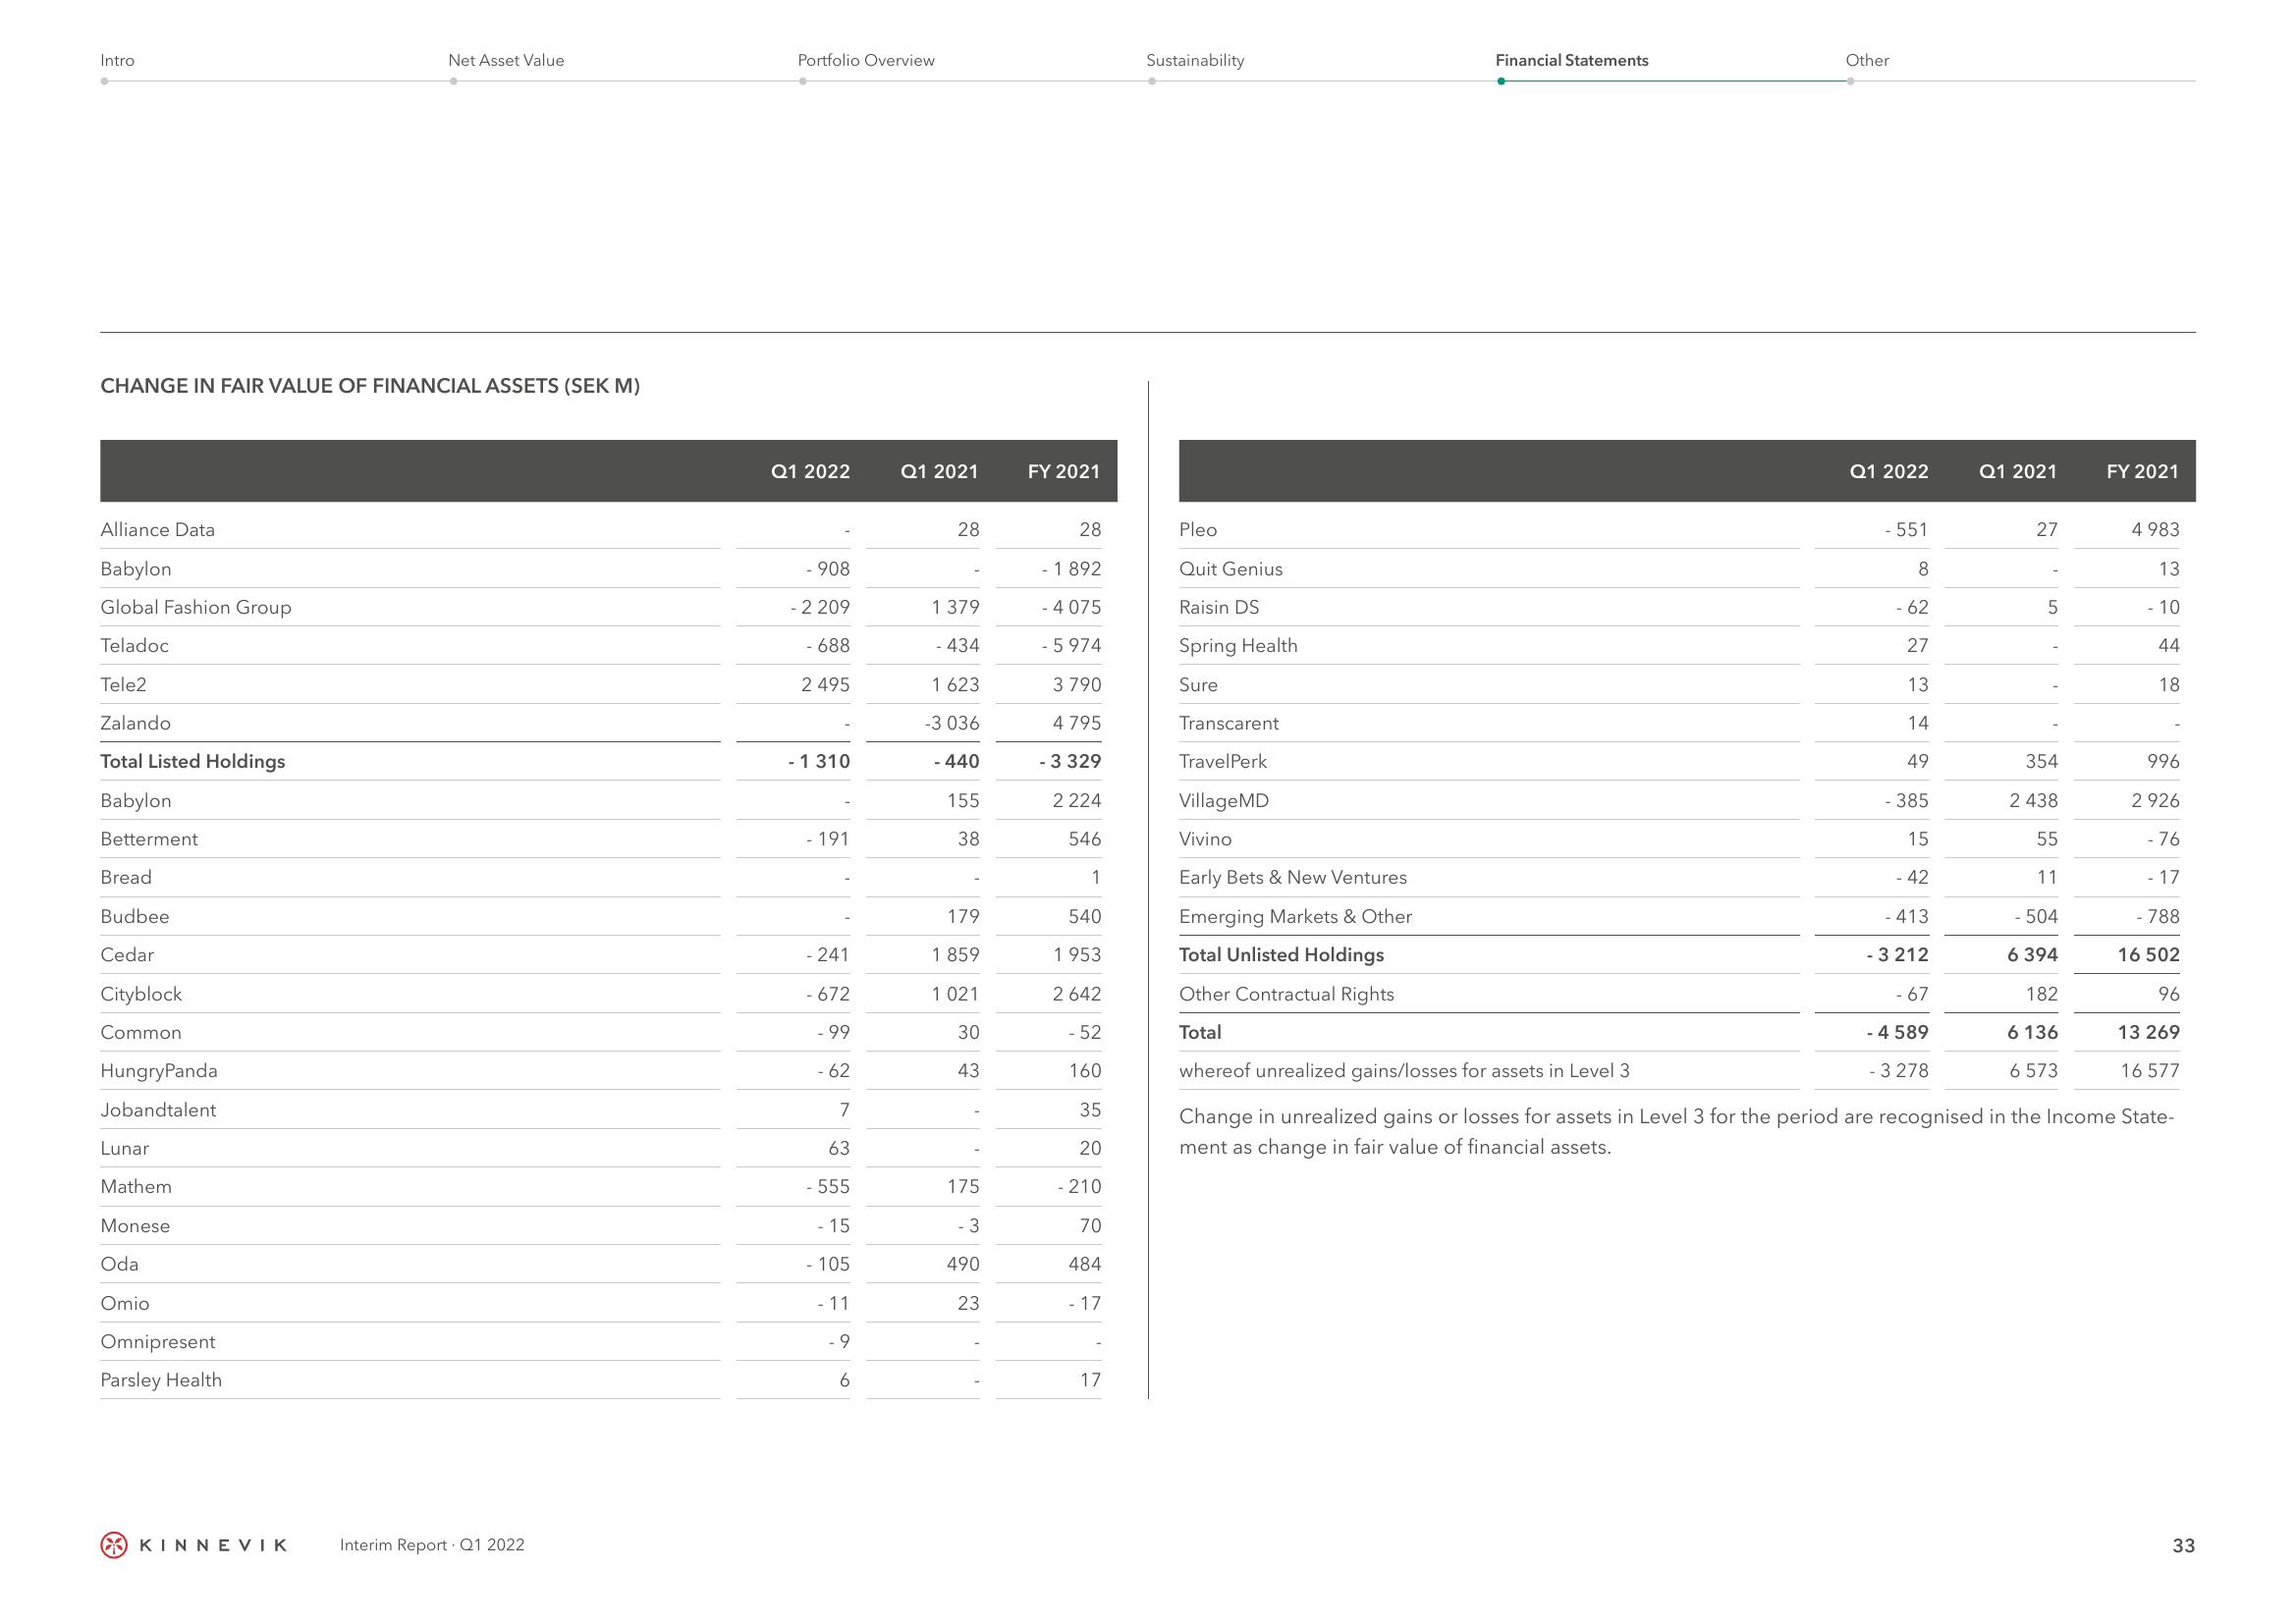
CHANGE IN FAIR VALUE OF FINANCIAL ASSETS (SEK M)
Alliance Data
Babylon
Global Fashion Group
Teladoc
Tele2
Zalando
Total Listed Holdings
Babylon
Betterment
Bread
Budbee
Cedar
Cityblock
Common
HungryPanda
Jobandtalent
Lunar
Mathem
Monese
Oda
Omio
Omnipresent
Parsley Health
Net Asset Value
KINNEVIK
Interim Report Q1 2022
Portfolio Overview
Q1 2022
- 908
- 2 209
-688
2 495
- 1310
- 191
- 241
- 672
- 99
- 62
7
63
- 555
- 15
- 105
- 11
- 9
6
Q1 2021
28
1 379
- 434
1 623
-3 036
- 440
155
38
179
1 859
1 021
30
43
175
- 3
490
23
FY 2021
28
- 1892
- 4 075
- 5 974
3 790
4 795
- 3 329
2 224
546
1
540
1953
2642
- 52
160
35
20
- 210
70
484
- 17
17
Sustainability
Pleo
Quit Genius
Raisin DS
Spring Health
Sure
Financial Statements
Other
Q1 2022
- 551
8
- 62
27
13
14
49
- 385
15
- 42
- 413
- 3 212
Q1 2021
- 67
- 4 589
- 3 278
27
5
Transcarent
TravelPerk
Village MD
Vivino
Early Bets & New Ventures
Emerging Markets & Other
Total Unlisted Holdings
Other Contractual Rights
Total
whereof unrealized gains/losses for assets in Level 3
Change in unrealized gains or losses for assets in Level 3 for the period are recognised in the Income State-
ment as change in fair value of financial assets.
354
2 438
55
11
504
FY 2021
6 394
182
6 136
6 573
4 983
13
- 10
44
18
996
2 926
-76
- 17
- 788
16 502
96
13 269
16 577
33View entire presentation