Rocket Companies IPO Presentation Deck slide image

Rocket Companies IPO Presentation Deck

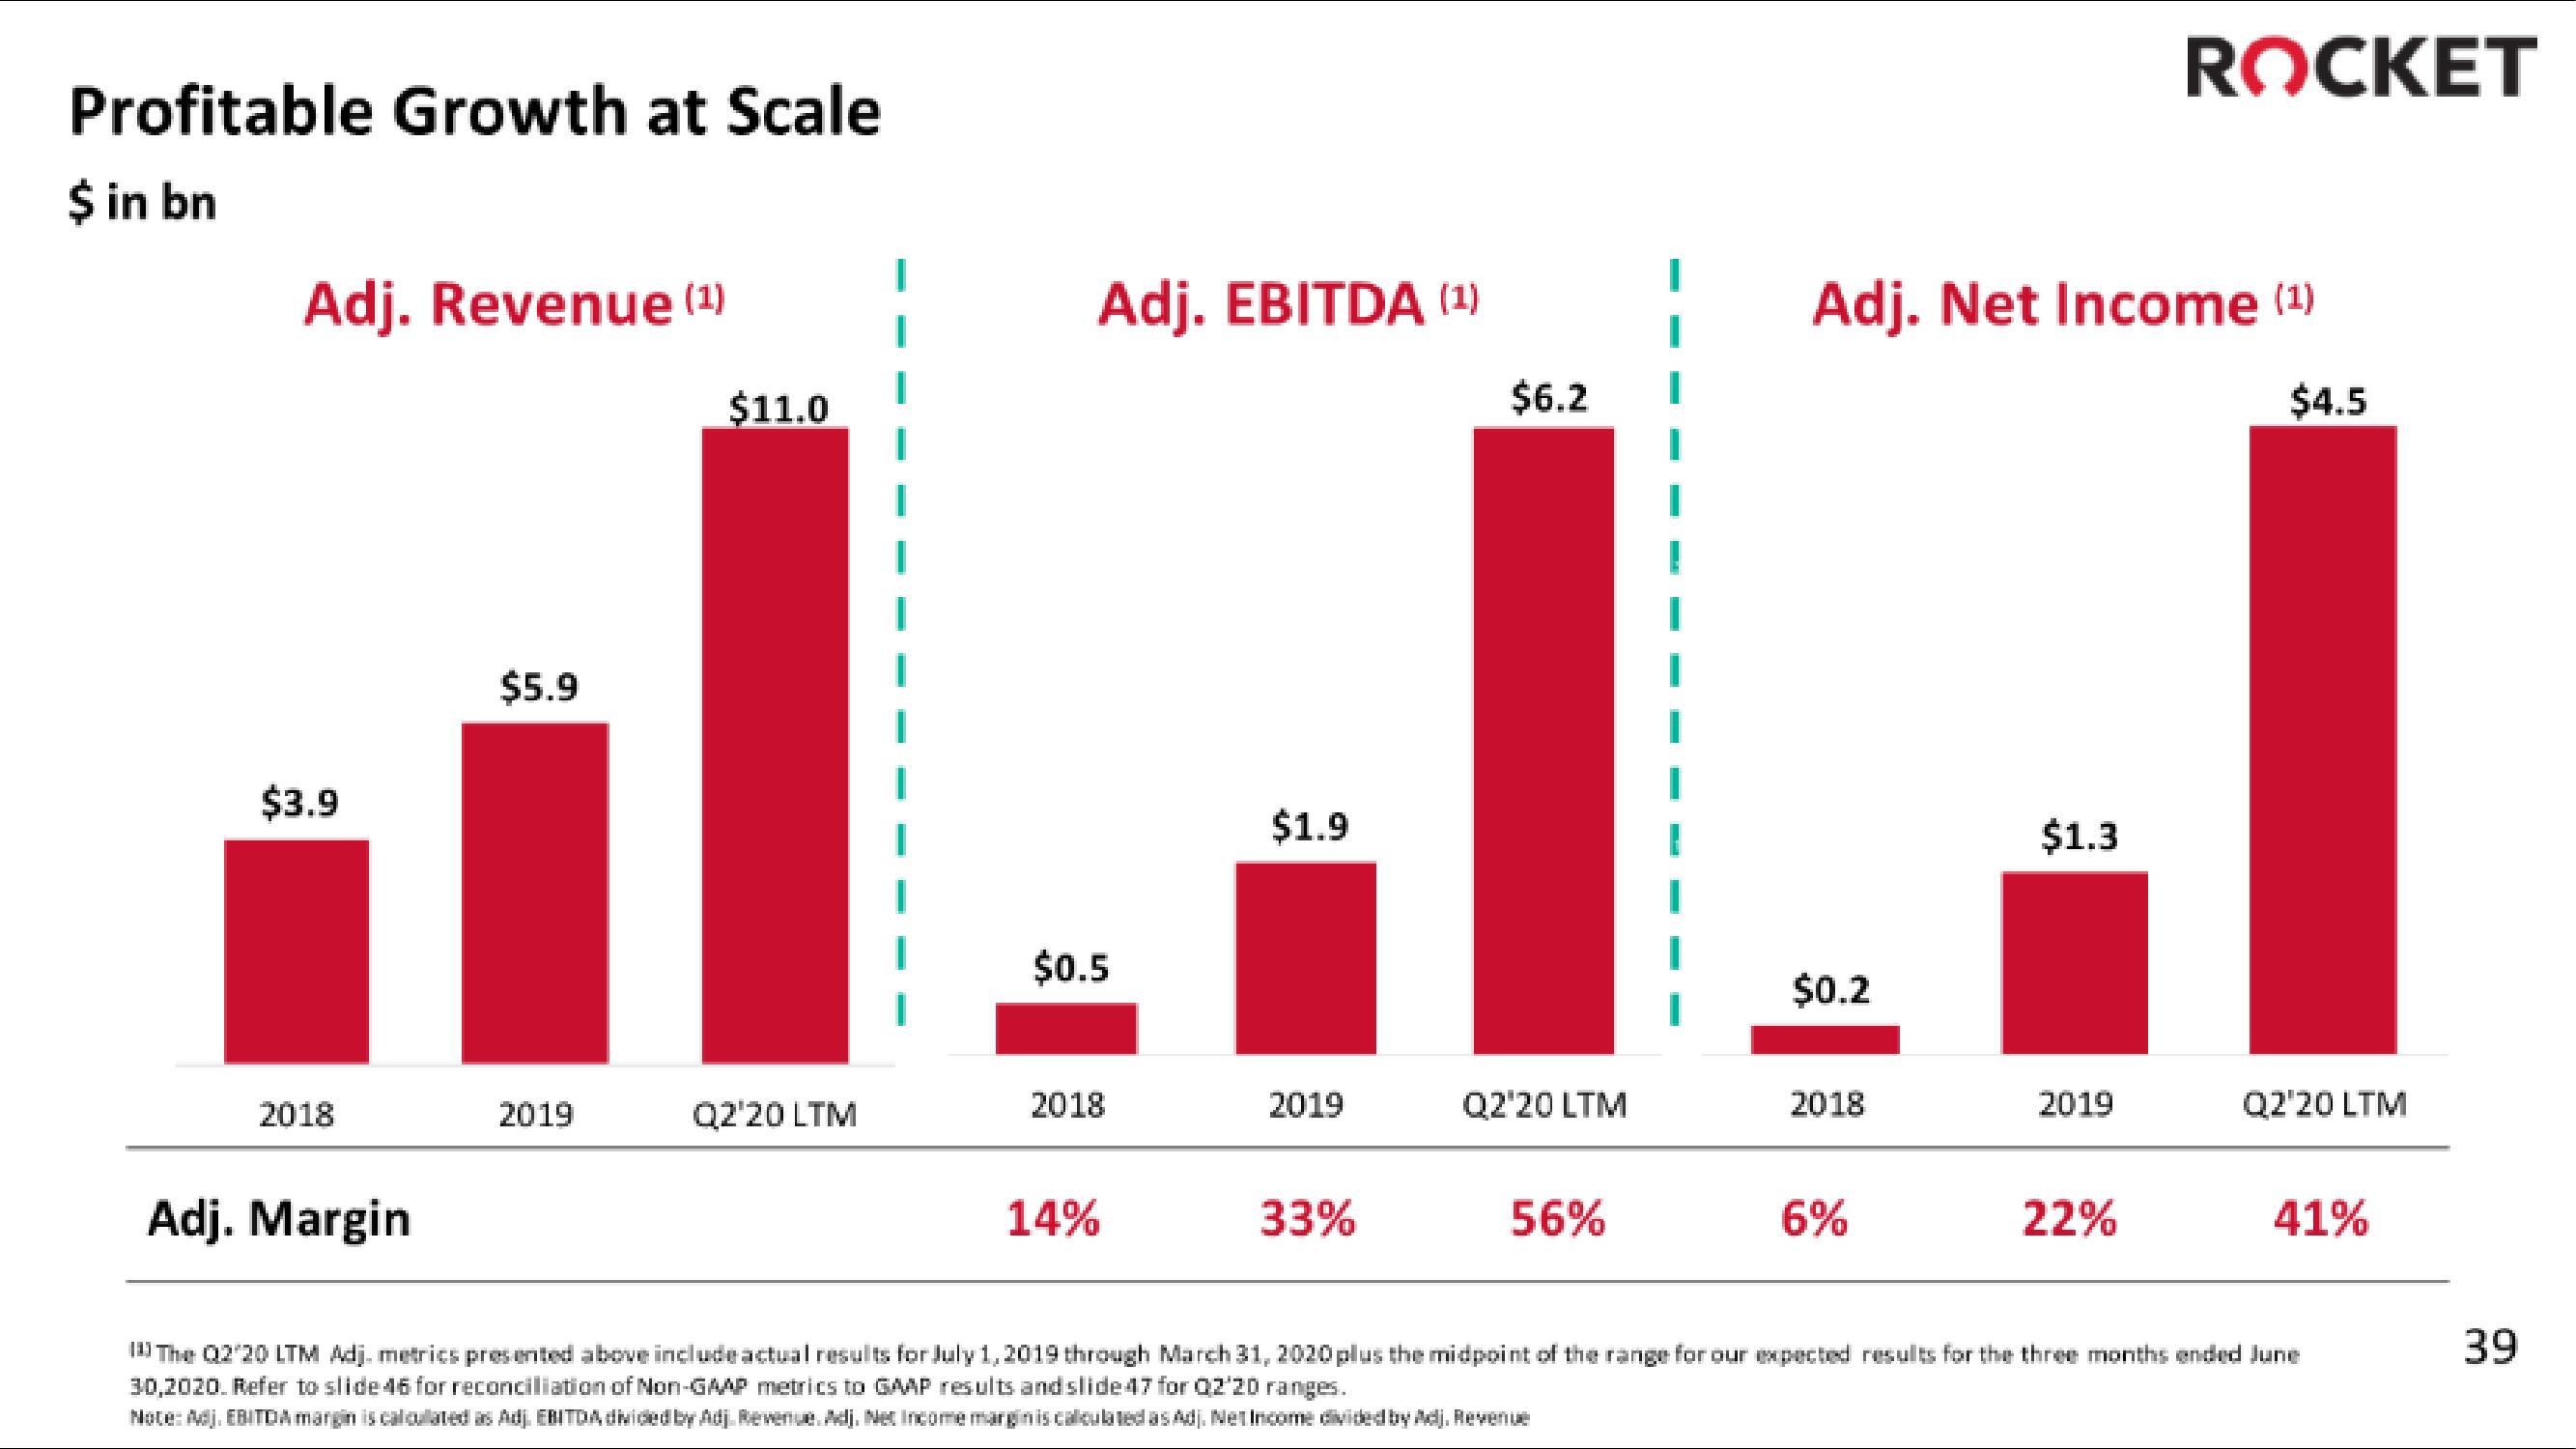
Profitable Growth at Scale $ in bn Adj. Revenue (¹) $3.9 2018 Adj. Margin $5.9 2019 $11.0 Q2'20 LTM Adj. EBITDA (1) $0.5 2018 14% $1.9 2019 33% $6.2 Q2'20 LTM 56% Adj. Net Income (¹) $0.2 2018 6% $1.3 2019 ROCKET 22% $4.5 Q2'20 LTM 41% The 02/20 LTM Adj, metrics presented above include actual results for July 1, 2019 through March 31, 2020 plus the midpoint of the range for our expected results for the three months ended June 30,2020. Refer to slide 46 for reconciliation of Non-GAAP metrics to GAAP results and slide 47 for Q2 20 ranges. Note: Adj. EBITDA margin is calculated as Adj. EBITDA divided by Adj. Revenue. Adj. Net Income margin is calculated as Adj. Net Income divided by Adj. Revenue 39
View entire presentation