BAT Investor Conference Presentation Deck
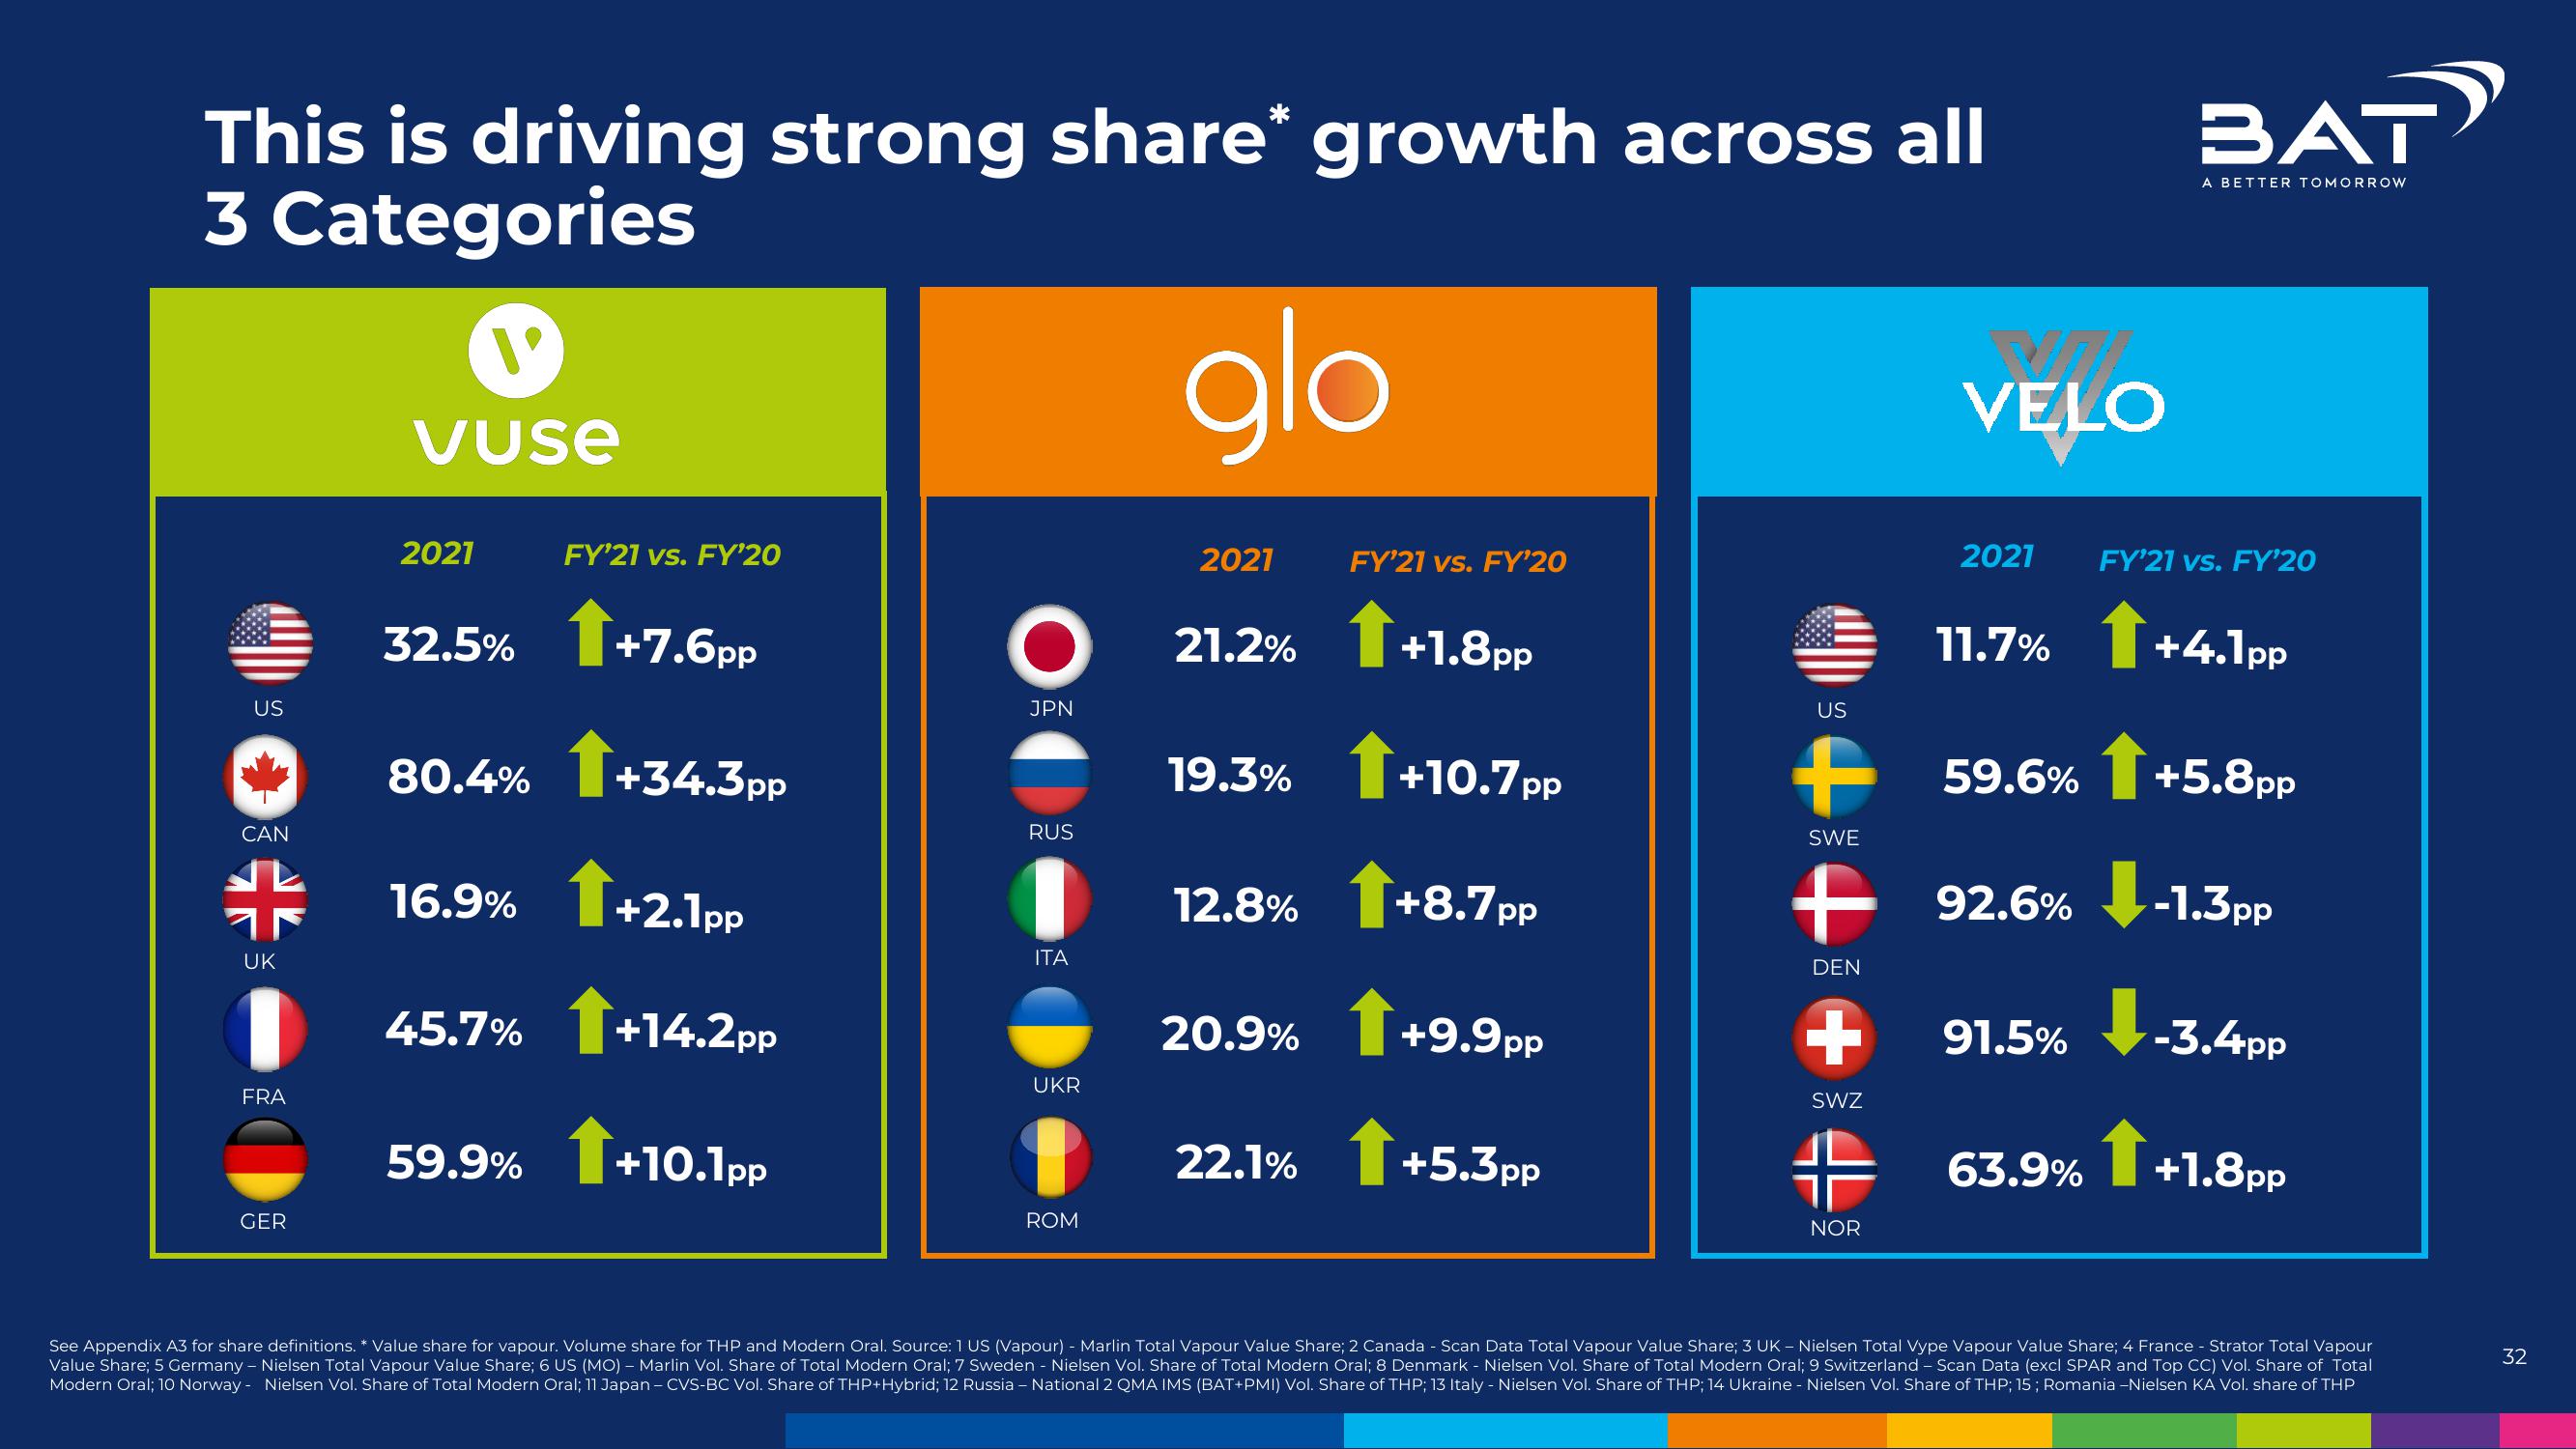
This is driving strong share* growth across all
3 Categories
US
CAN
UK
FRA
GER
vuse
2021
FY'21 vs. FY'20
32.5% 1+7.6pp
80.4% 1+34.3 pp
16.9% 1+2.1pp
45.7% +14.2pp
59.9%
+10.1pp
O
JPN
RUS
ITA
UKR
ROM
glo
2021
21.2%
19.3%
12.8%
20.9%
FY'21 vs. FY'20
+1.8pp
1+10.7 pp
+8.7pp
1+9.9pp
22.1% +5.3pp
VELO
2021
SWZ
+
NOR
US
+ 59.6%
SWE
+ 92.6%
DEN
BAT
11.7% +4.1pp
A BETTER TOMORROW
FY'21 vs. FY'20
59.6% +5.8pp
63.9%
92.6% -1.3pp
91.5% -3.4pp
1+1.8 pp
See Appendix A3 for share definitions. * Value share for vapour. Volume share for THP and Modern Oral. Source: 1 US (Vapour) - Marlin Total Vapour Value Share; 2 Canada - Scan Data Total Vapour Value Share; 3 UK - Nielsen Total Vype Vapour Value Share; 4 France - Strator Total Vapour
Value Share; 5 Germany - Nielsen Total Vapour Value Share; 6 US (MO) - Marlin Vol. Share of Total Modern Oral; 7 Sweden - Nielsen Vol. Share of Total Modern Oral; 8 Denmark - Nielsen Vol. Share of Total Modern Oral; 9 Switzerland - Scan Data (excl SPAR and Top CC) Vol. Share of Total
Modern Oral; 10 Norway - Nielsen Vol. Share of Total Modern Oral; 11 Japan - CVS-BC Vol. Share of THP+Hybrid; 12 Russia - National 2 QMA IMS (BAT+PMI) Vol. Share of THP; 13 Italy - Nielsen Vol. Share of THP; 14 Ukraine - Nielsen Vol. Share of THP; 15; Romania -Nielsen KA Vol. share of THP
32View entire presentation