Marti Results Presentation Deck
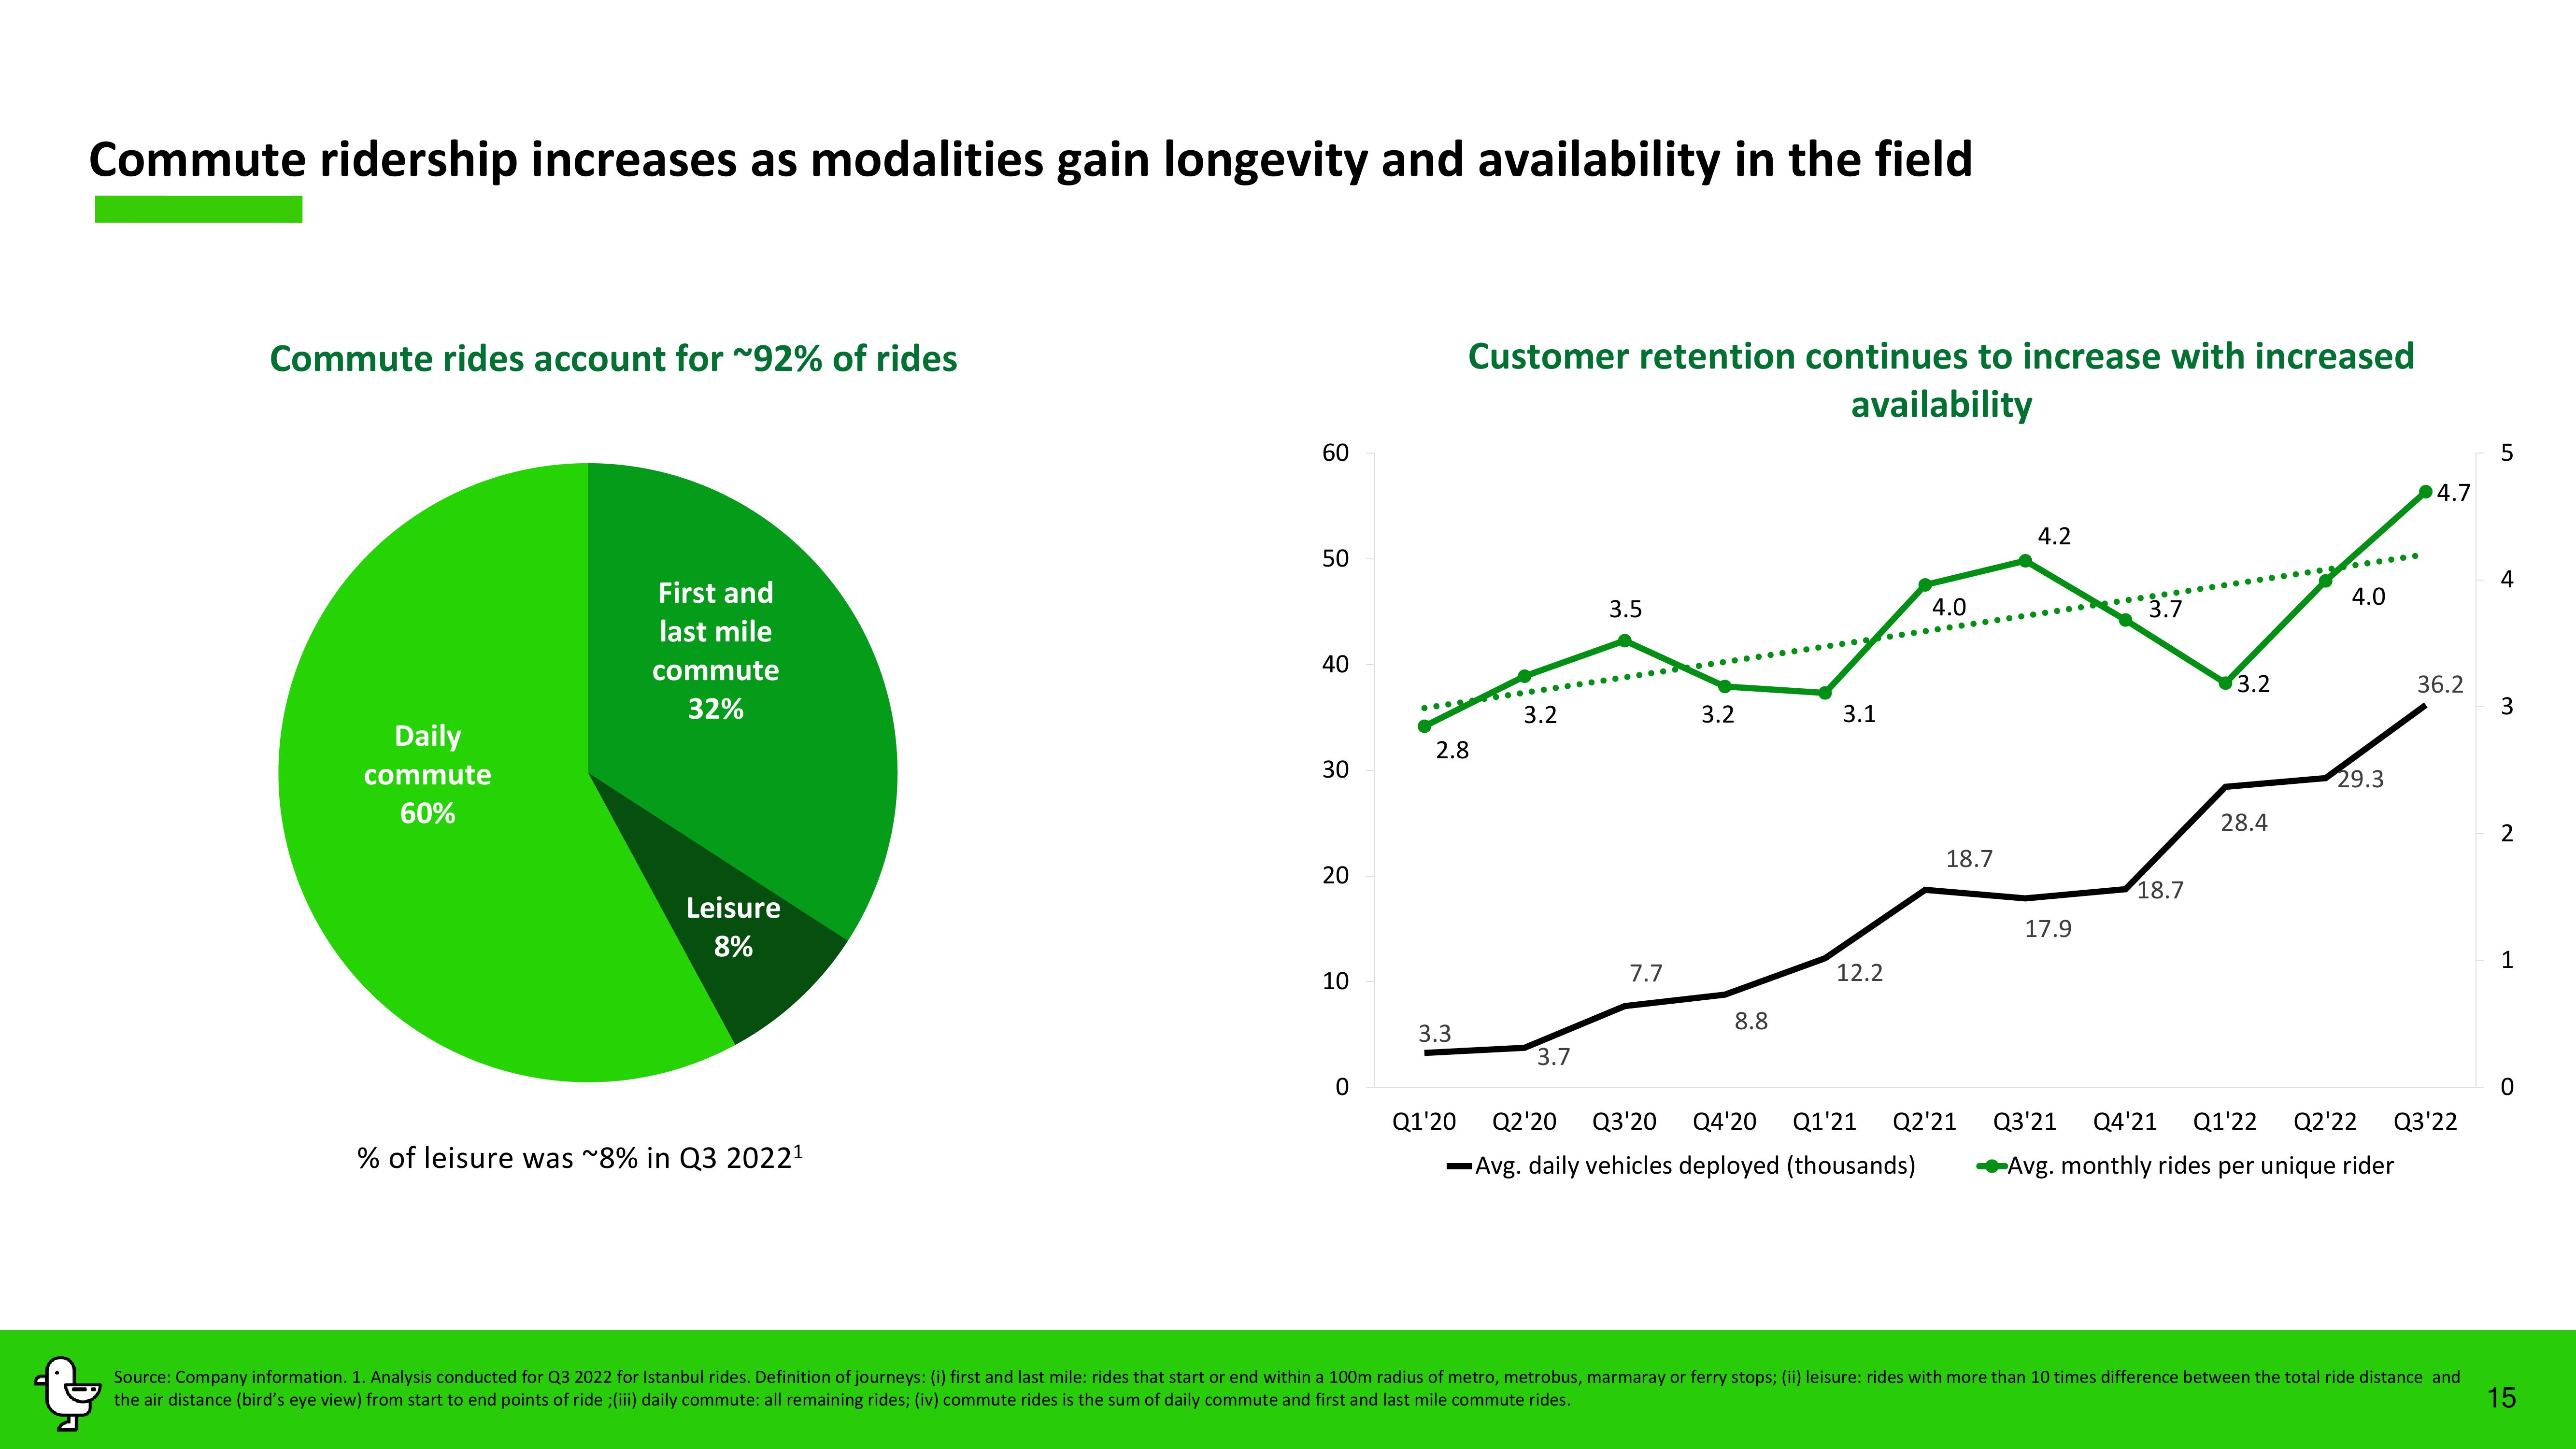
Commute ridership increases as modalities gain longevity and availability in the field
Commute rides account for ~92% of rides
Daily
commute
60%
First and
last mile
commute
32%
Leisure
8%
% of leisure was ~8% in Q3 2022¹
60
50
40
30
20
10
0
2.8
3.3
Customer retention continues to increase with increased
availability
Q1'20
3.2
3.7
3.5
7.7
3.2
8.8
3.1
12.2
4.0
18.7
Q2'20 Q3'20 Q4'20 Q1'21 Q2'21
-Avg. daily vehicles deployed (thousands)
4.2
17.9
3.7
18.7
3.2
28.4
4.0
29.3
4.7
36.2
Q3'21 Q4'21 Q1'22 Q2'22 Q3'22
Avg. monthly rides per unique rider
5
4
3
2
1
0
Source: Company information. 1. Analysis conducted for Q3 2022 for Istanbul rides. Definition of journeys: (i) first and last mile: rides that start or end within a 100m radius of metro, metrobus, marmaray or ferry stops; (ii) leisure: rides with more than 10 times difference between the total ride distance and
the air distance (bird's eye view) from start to end points of ride ;(iii) daily commute: all remaining rides; (iv) commute rides is the sum of daily commute and first and last mile commute rides.
15View entire presentation