J.P.Morgan 2Q23 Investor Results
JPMORGAN CHASE & CO.
CONSUMER & COMMUNITY BANKING
FINANCIAL HIGHLIGHTS, CONTINUED
(in millions, except ratio data and where otherwise noted)
BUSINESS METRICS
Number of:
Branches
Active digital customers (in thousands) (a)
Active mobile customers (in thousands) (b)
Debit and credit card sales volume (in billions)
Total payments transaction volume (in trillions) (c)
Banking & Wealth Management
Average deposits
Deposit margin
Business Banking average loans
Business Banking origination volume
Client investment assets (d)
Number of client advisors
Home Lending (in billions)
Mortgage origination volume by channel
Retail
Correspondent
Total mortgage origination volume (e)
Third-party mortgage loans serviced (period-end)
MSR carrying value (period-end)
Card Services
Sales volume, excluding commercial card (in billions)
Net revenue rate
Net yield on average loans
Auto
Loan and lease origination volume (in billions)
Average auto operating lease assets
$
$
$
$
$
2Q23
$
4,874
65,559 (f)
51,963 (f)
$ 1,142,755 (g) $ 1,098,494
2.83 %
19,628
1,275
892,897
5,153
424.0 $
1.5 (f)
7.3 (h) $
3.9
11.2 $
604.5
8.2
294.0
9.11 %
9.31
$
12.0
11,015
$
1Q23
$
4,784
64,998
50,933
387.3
1.4
2.78 %
19,884
1,027
690,819
5,125
3.6
2.1
5.7
575.9
7.7
266.2
10.38 %
9.89
9.2
11,538
$
$
$
4Q22
$ 1,126,420
$
4,787
63,136
49,710
411.1
1.4
2.48 %
20,467
1,081
647,120
5,029
4.6
2.1
6.7
584.3
8.0
QUARTERLY TRENDS
284.8
10.06 %
9.78
7.5
12,333
$
$
$ 1,156,933
$
3Q22
$
4,802
61,985
48,904
$ 21,263
977
615,048
5,017
$
395.8
1.4
1.83 %
7.8
4.3
12.1
586.7
8.1
$
7.5
13,466
$
$
$ 1,163,423
$
272.3 $
9.92 %
9.81
2Q22
$
4,822
60,735
47,436
397.0
1.5
1.31 %
22,769
1,196
628,479
4,890
11.0
10.9
21.9
575.6
7.4
271.2
9.59 %
9.50
7.0
14,866
2Q23 Change
1Q23
2%
1
2
9
7
4
(1)
24
29
1
103
86
96
5
6
10
30
(5)
JPMORGAN CHASE & Co.
2Q22
1%
8
10
7
(2)
(14)
7
42
5
(34)
(64)
(49)
5
11
8
71
(26)
$
$
$
$
2023
$
4,874
65,559 (f)
51,963 (f)
811.3
2.9 (f)
SIX MONTHS ENDED JUNE 30,
$ 1,120,746 (g) $ 1,149,844
2.81 %
19,755
2,302
892,897
5,153
560.2
$
10.9 (h) $
6.0
16.9
604.5
8.2
9.73 %
9.60
21.2
11,275
2022
$
4,822
60,735
47,436
$
748.5
2.8
$ 23,787
2,224
628,479
4,890
1.27 %
26.1
20.5
46.6
575.6
7.4
507.6
9.72 %
9.73
15.4
15,640
2023 Change
2022
1%
8
10
8
4
(3)
(17)
4
42
5
(58)
(71)
(64)
5
11
10
38
(28)
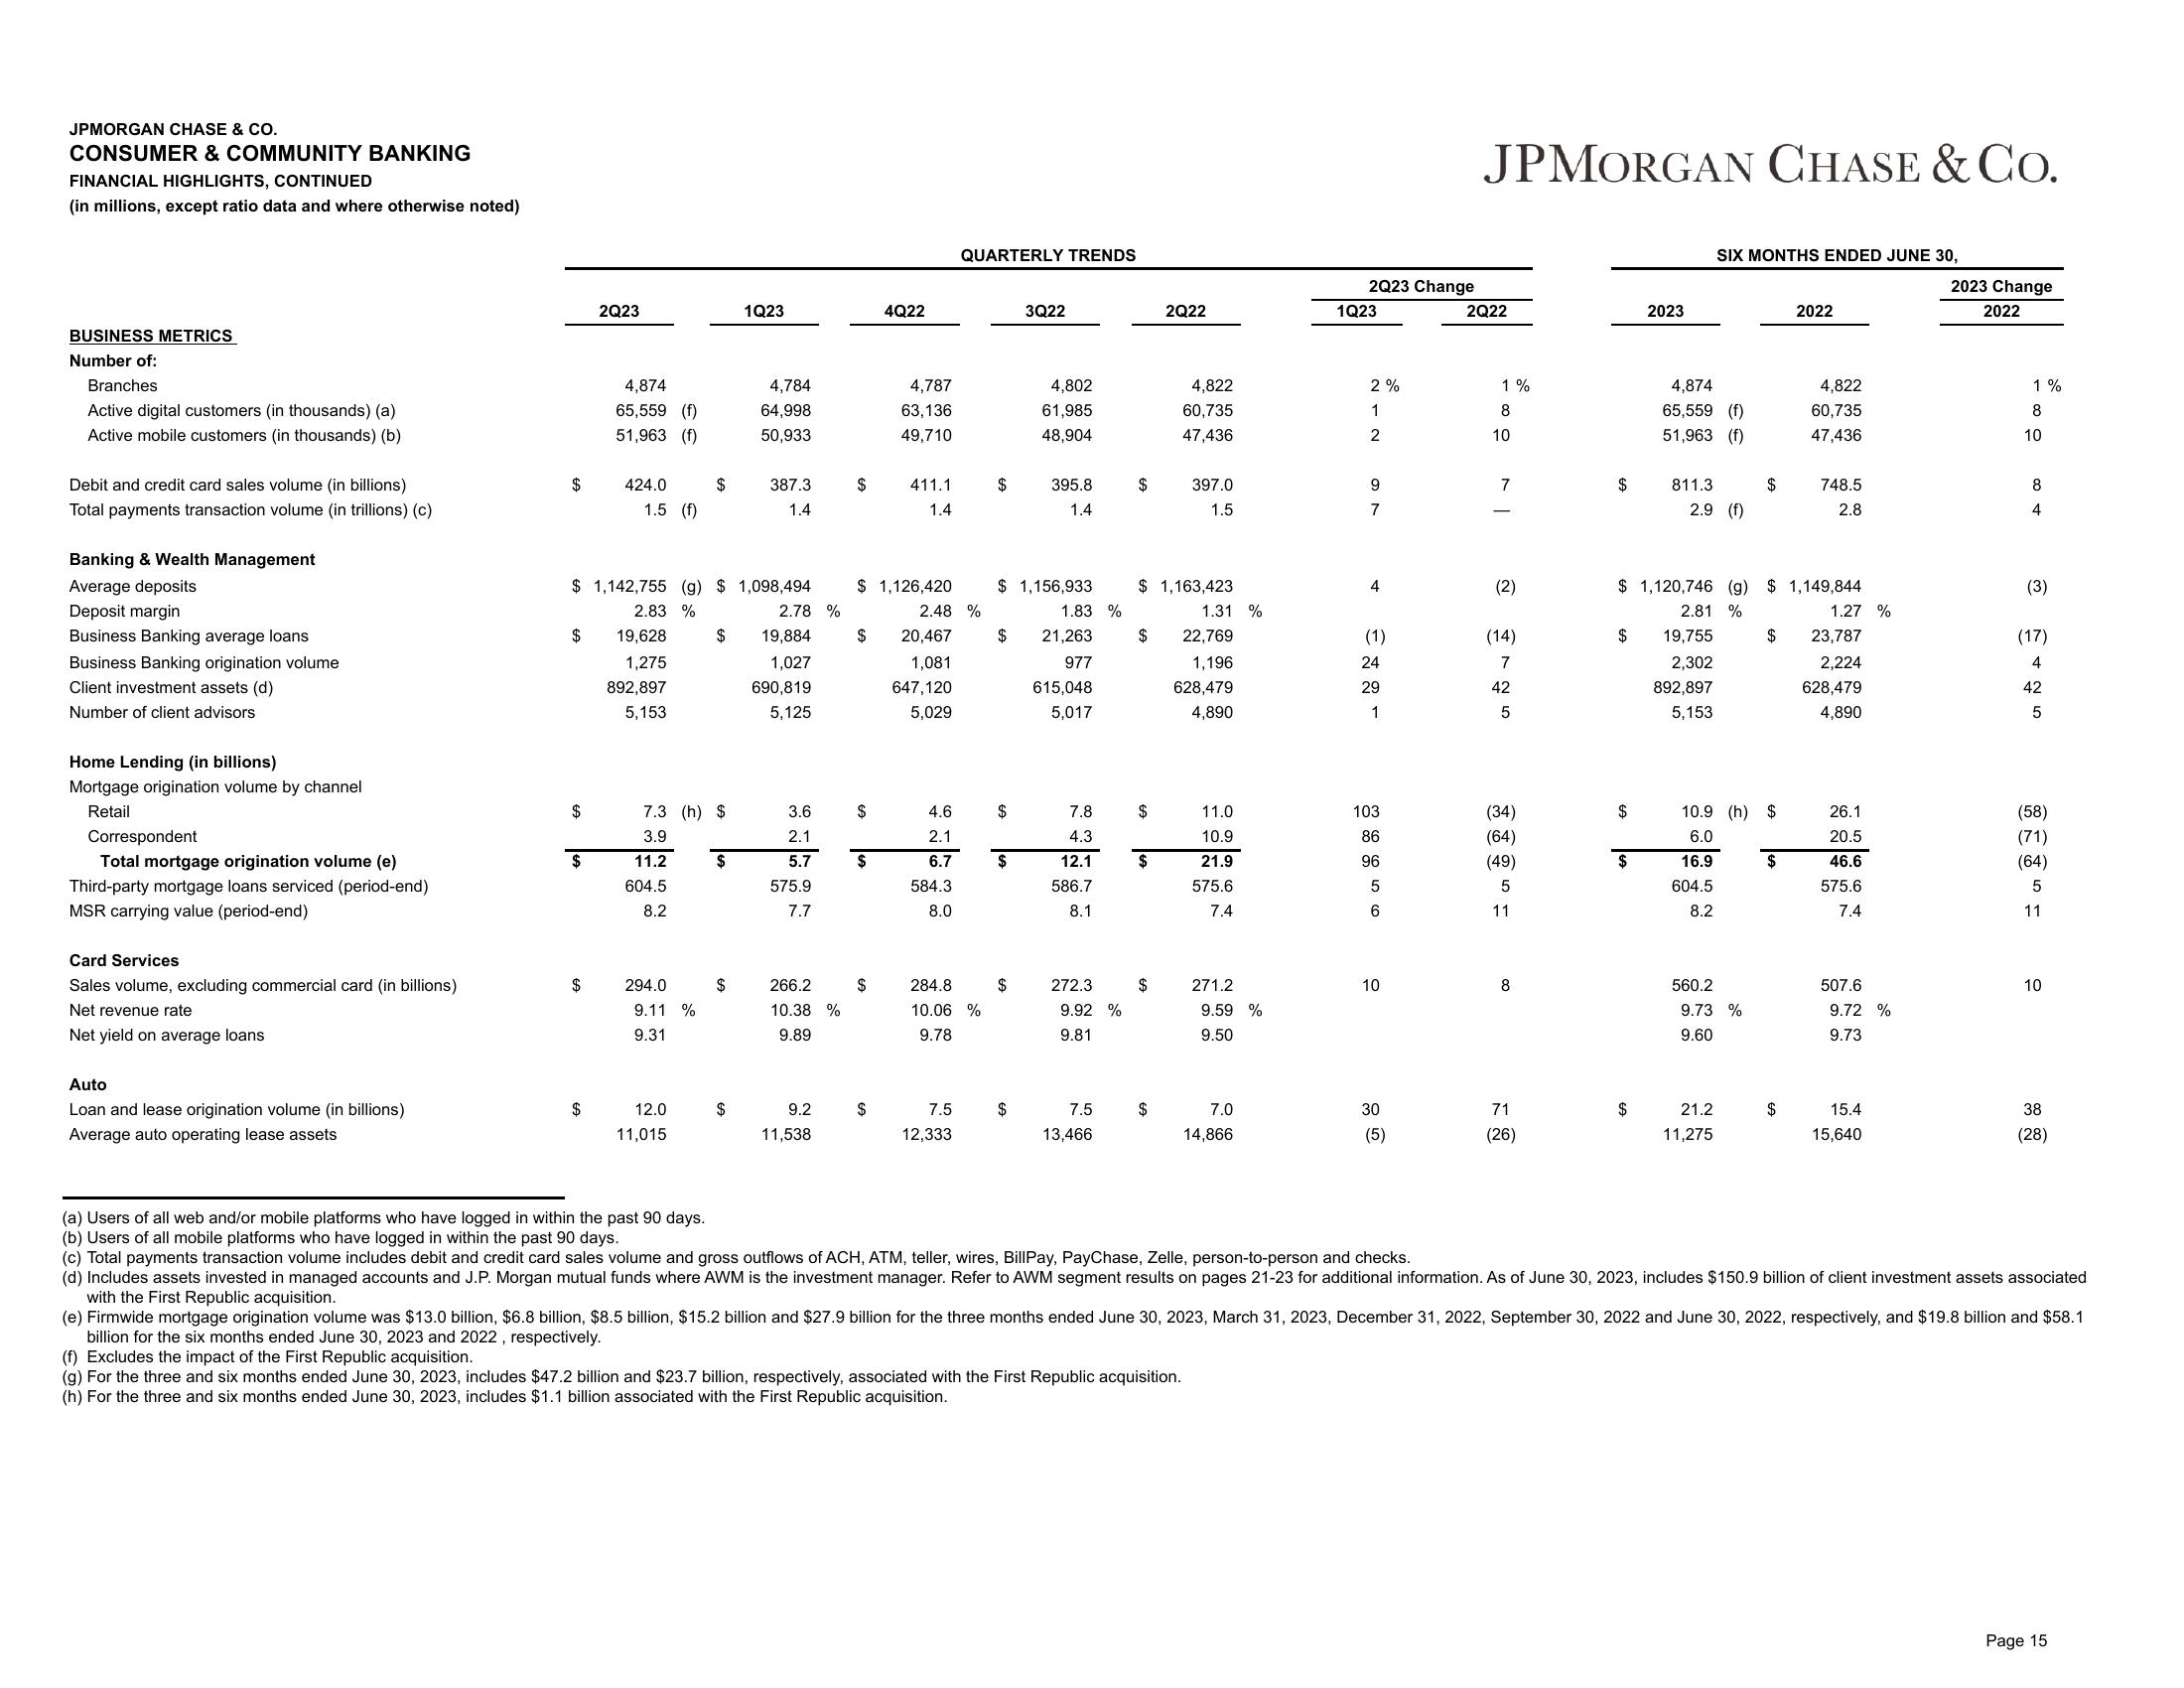
(a) Users of all web and/or mobile platforms who have logged in within the past 90 days.
(b) Users of all mobile platforms who have logged in within the past 90 days.
(c) Total payments transaction volume includes debit and credit card sales volume and gross outflows of ACH, ATM, teller, wires, BillPay, PayChase, Zelle, person-to-person and checks.
(d)
assets
managed accounts and J.P. Morgan tual funds where AWM the investment manager. Refer to AWM segment results on pages 21-23 for additional information. As of June 30, 2023, includes 150.9 billion of client
with the First Republic acquisition.
(e) Firmwide mortgage origination volume was $13.0 billion, $6.8 billion, $8.5 billion, $15.2 billion and $27.9 billion for the three months ended June 30, 2023, March 31, 2023, December 31, 2022, September 30, 2022 and June 30, 2022, respectively, and $19.8 billion and $58.1
billion for the six months ended June 30, 2023 and 2022, respectively.
(f) Excludes the impact of the First Republic acquisition.
(g) For the three and six months ended June 30, 2023, includes $47.2 billion and $23.7 billion, respectively, associated with the First Republic acquisition.
(h) For the three and six months ended June 30, 2023, includes $1.1 billion associated with the First Republic acquisition.
associated.
Page 15View entire presentation