Snap Inc Results Presentation Deck
Average Revenue Per User (ARPU)
(unaudited)
GLOBAL
$1.53
Q4'17
EUROPE ²
$0.66
Q4'17
$1.21
Q1'18
$0.53
Q1'18
$1.40
Q2'18
$0.66
Q2'18
+39%
$1.60
Q3'18
+47%
$0.85
Q3'18
$2.09
Q4'18
$1.04
Q4'18
$1.68
Q1'19
$0.77
Q1'19
NORTH AMERICA¹
$2.75
Q4'17
$0.56
REST OF WORLD
Q4'17
$2.10
Q1'18
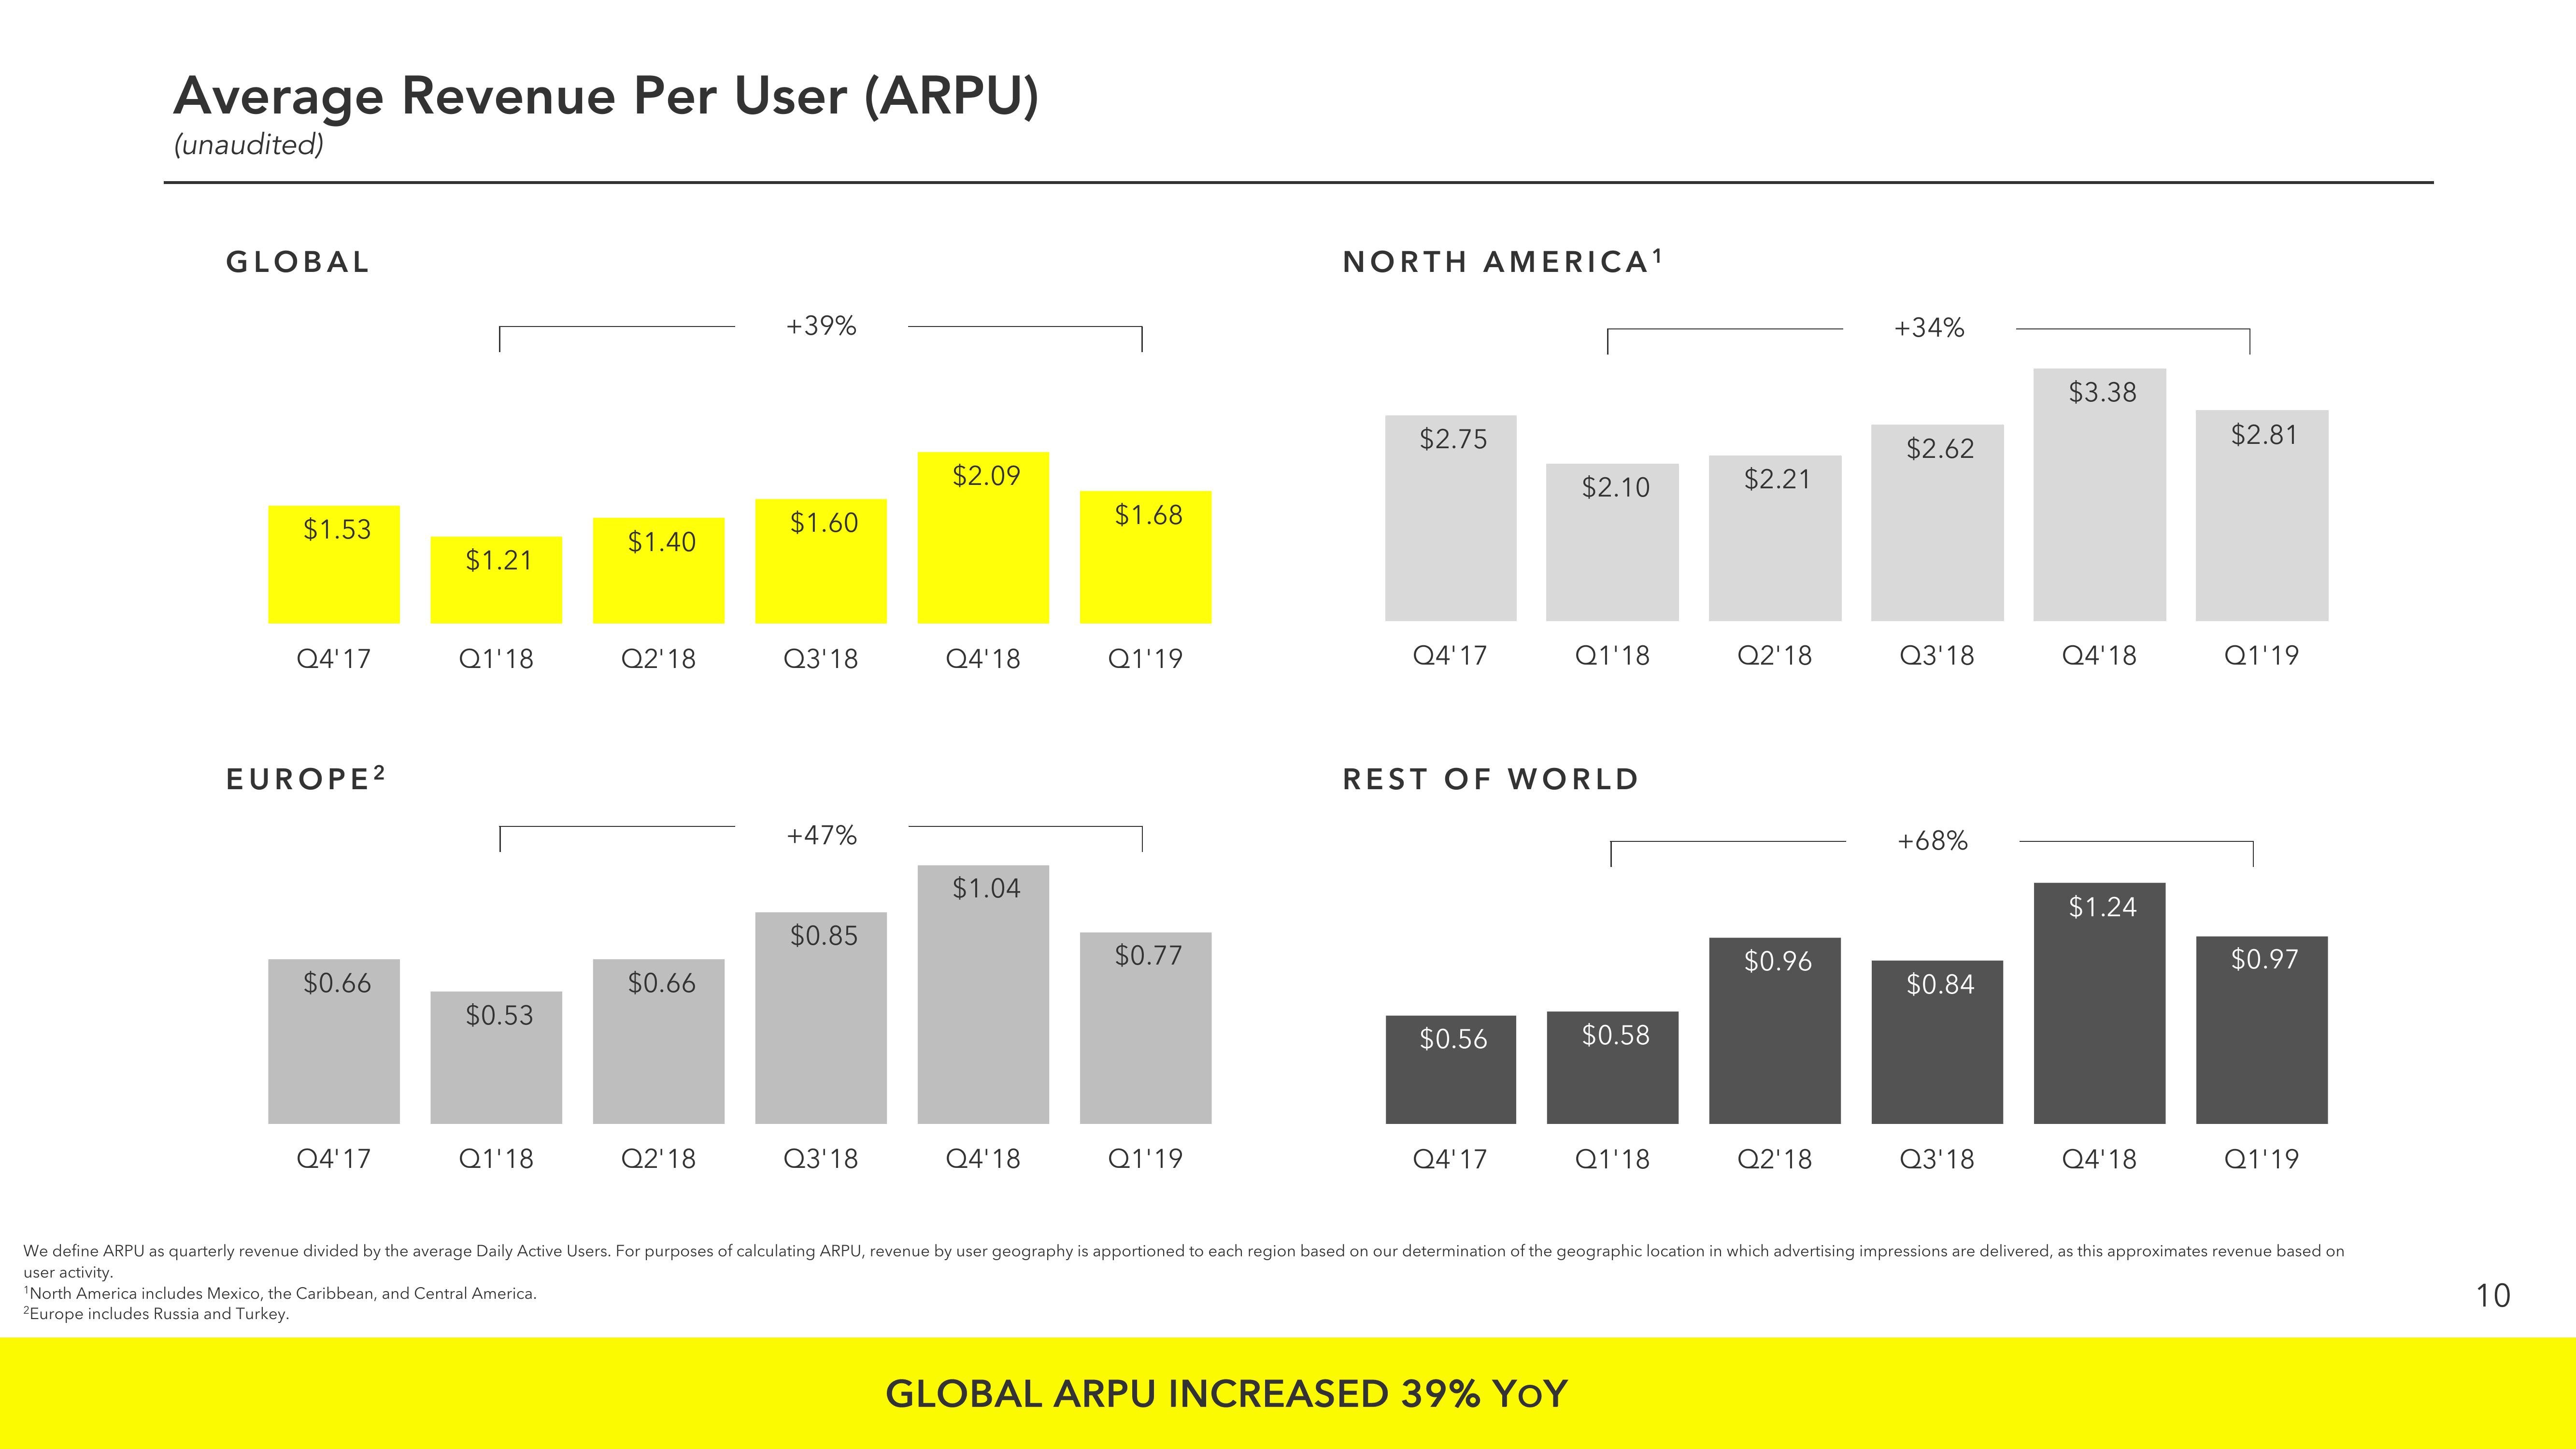
GLOBAL ARPU INCREASED 39% YOY
$0.58
Q1'18
$2.21
Q2'18
$0.96
Q2'18
+34%
$2.62
Q3'18
+68%
$0.84
Q3'18
$3.38
Q4'18
$1.24
Q4'18
$2.81
Q1'19
$0.97
Q1'19
We define ARPU as quarterly revenue divided by the average Daily Active Users. For purposes of calculating ARPU, revenue by user geography is apportioned to each region based on our determination of the geographic location in which advertising impressions are delivered, as this approximates revenue based on
user activity.
¹North America includes Mexico, the Caribbean, and Central America.
2Europe includes Russia and Turkey.
10View entire presentation