Prada Results Presentation Deck slide image

Prada Results Presentation Deck

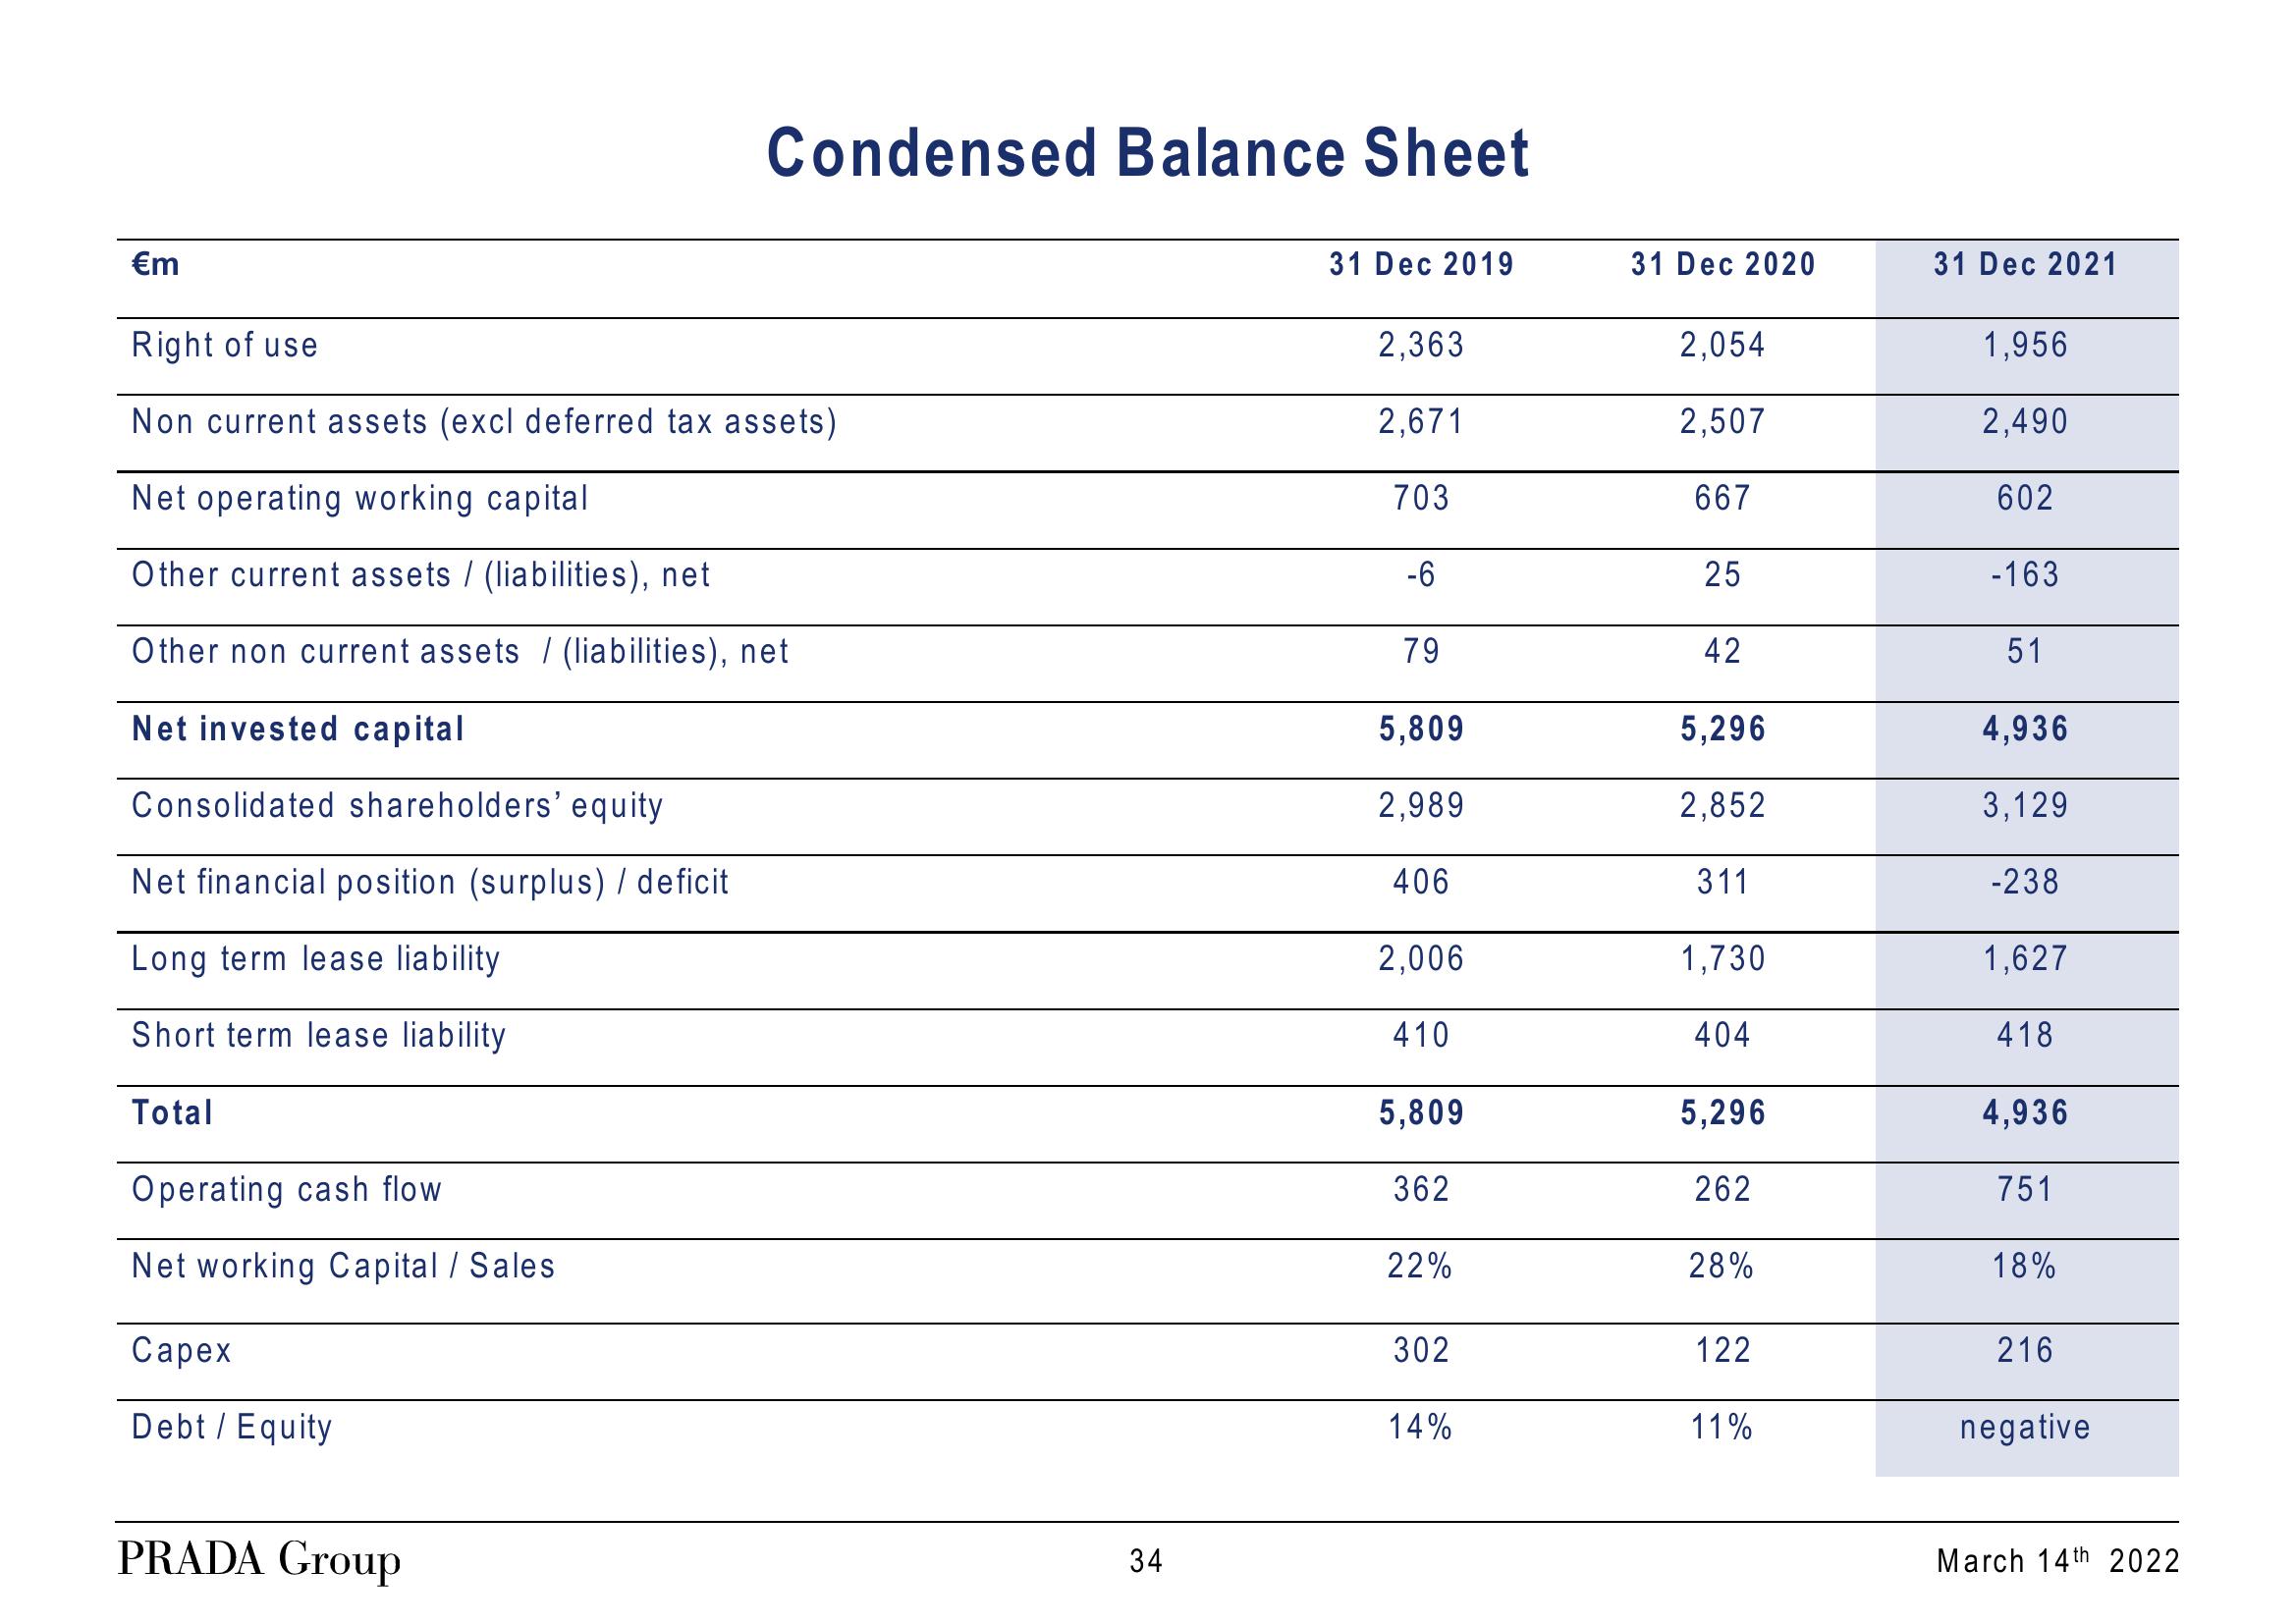
€m Right of use Non current assets (excl deferred tax assets) Net operating working capital Other current assets/ (liabilities), net Other non current assets/ (liabilities), net Net invested capital Consolidated shareholders' equity Net financial position (surplus) / deficit Long term lease liability Short term lease liability Total Operating cash flow Net working Capital / Sales Capex Debt / Equity Condensed Balance Sheet PRADA Group 34 31 Dec 2019 2,363 2,671 703 -6 79 5,809 2,989 406 2,006 410 5,809 362 22% 302 14% 31 Dec 2020 2,054 2,507 667 25 42 5,296 2,852 311 1,730 404 5,296 262 28% 122 11% 31 Dec 2021 1,956 2,490 602 -163 51 4,936 3,129 -238 1,627 418 4,936 751 18% 216 negative March 14th 2022
View entire presentation