Hypebeast SPAC Presentation Deck
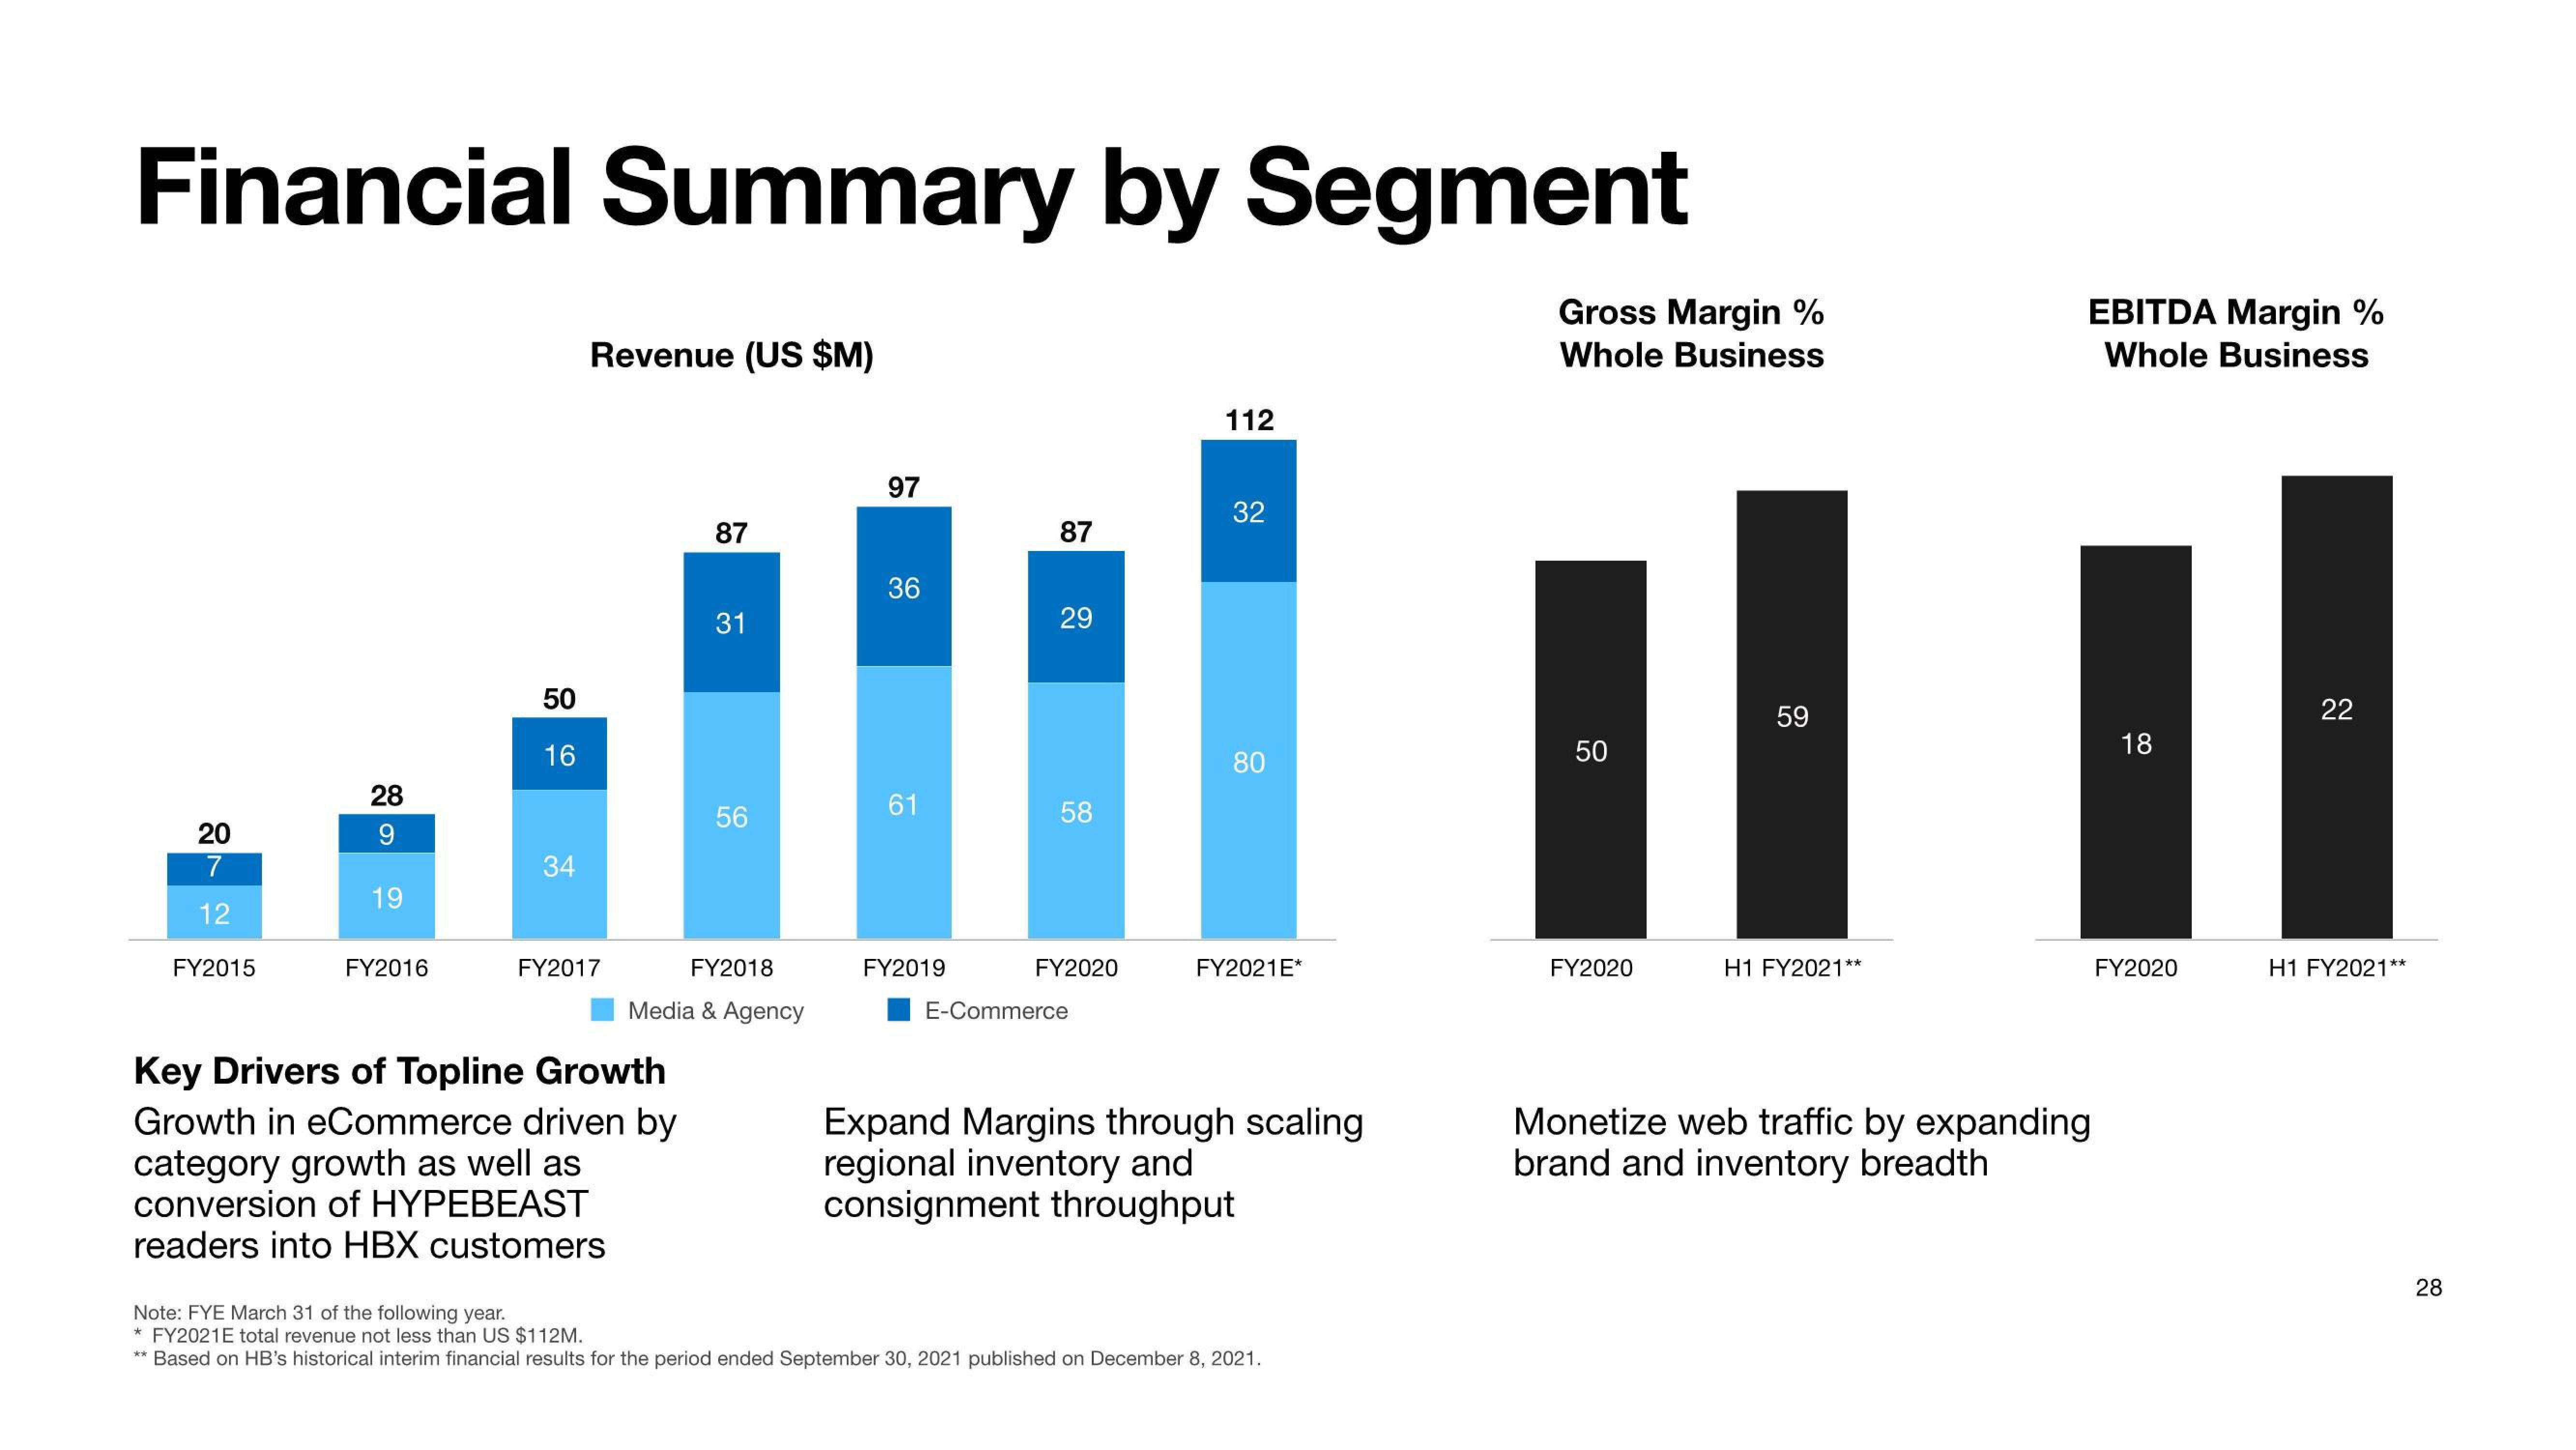
Financial Summary by Segment
20
7
12
FY2015
28
9
19
FY2016
50
16
34
Revenue (US $M)
FY2017
87
Key Drivers of Topline Growth
Growth in eCommerce driven by
category growth as well as
conversion of HYPEBEAST
readers into HBX customers
31
56
FY2018
Media & Agency
97
36
61
FY2019
87
29
58
FY2020
E-Commerce
112
32
80
FY2021E*
Expand Margins through scaling
regional inventory and
consignment throughput
Note: FYE March 31 of the following year.
* FY2021E total revenue not less than US $112M.
** Based on HB's historical interim financial results for the period ended September 30, 2021 published on December 8, 2021.
Gross Margin %
Whole Business
50
FY2020
59
H1 FY2021**
EBITDA Margin %
Whole Business
Monetize web traffic by expanding
brand and inventory breadth
18
FY2020
22
H1 FY2021**
28View entire presentation