UBS Results Presentation Deck slide image

UBS Results Presentation Deck

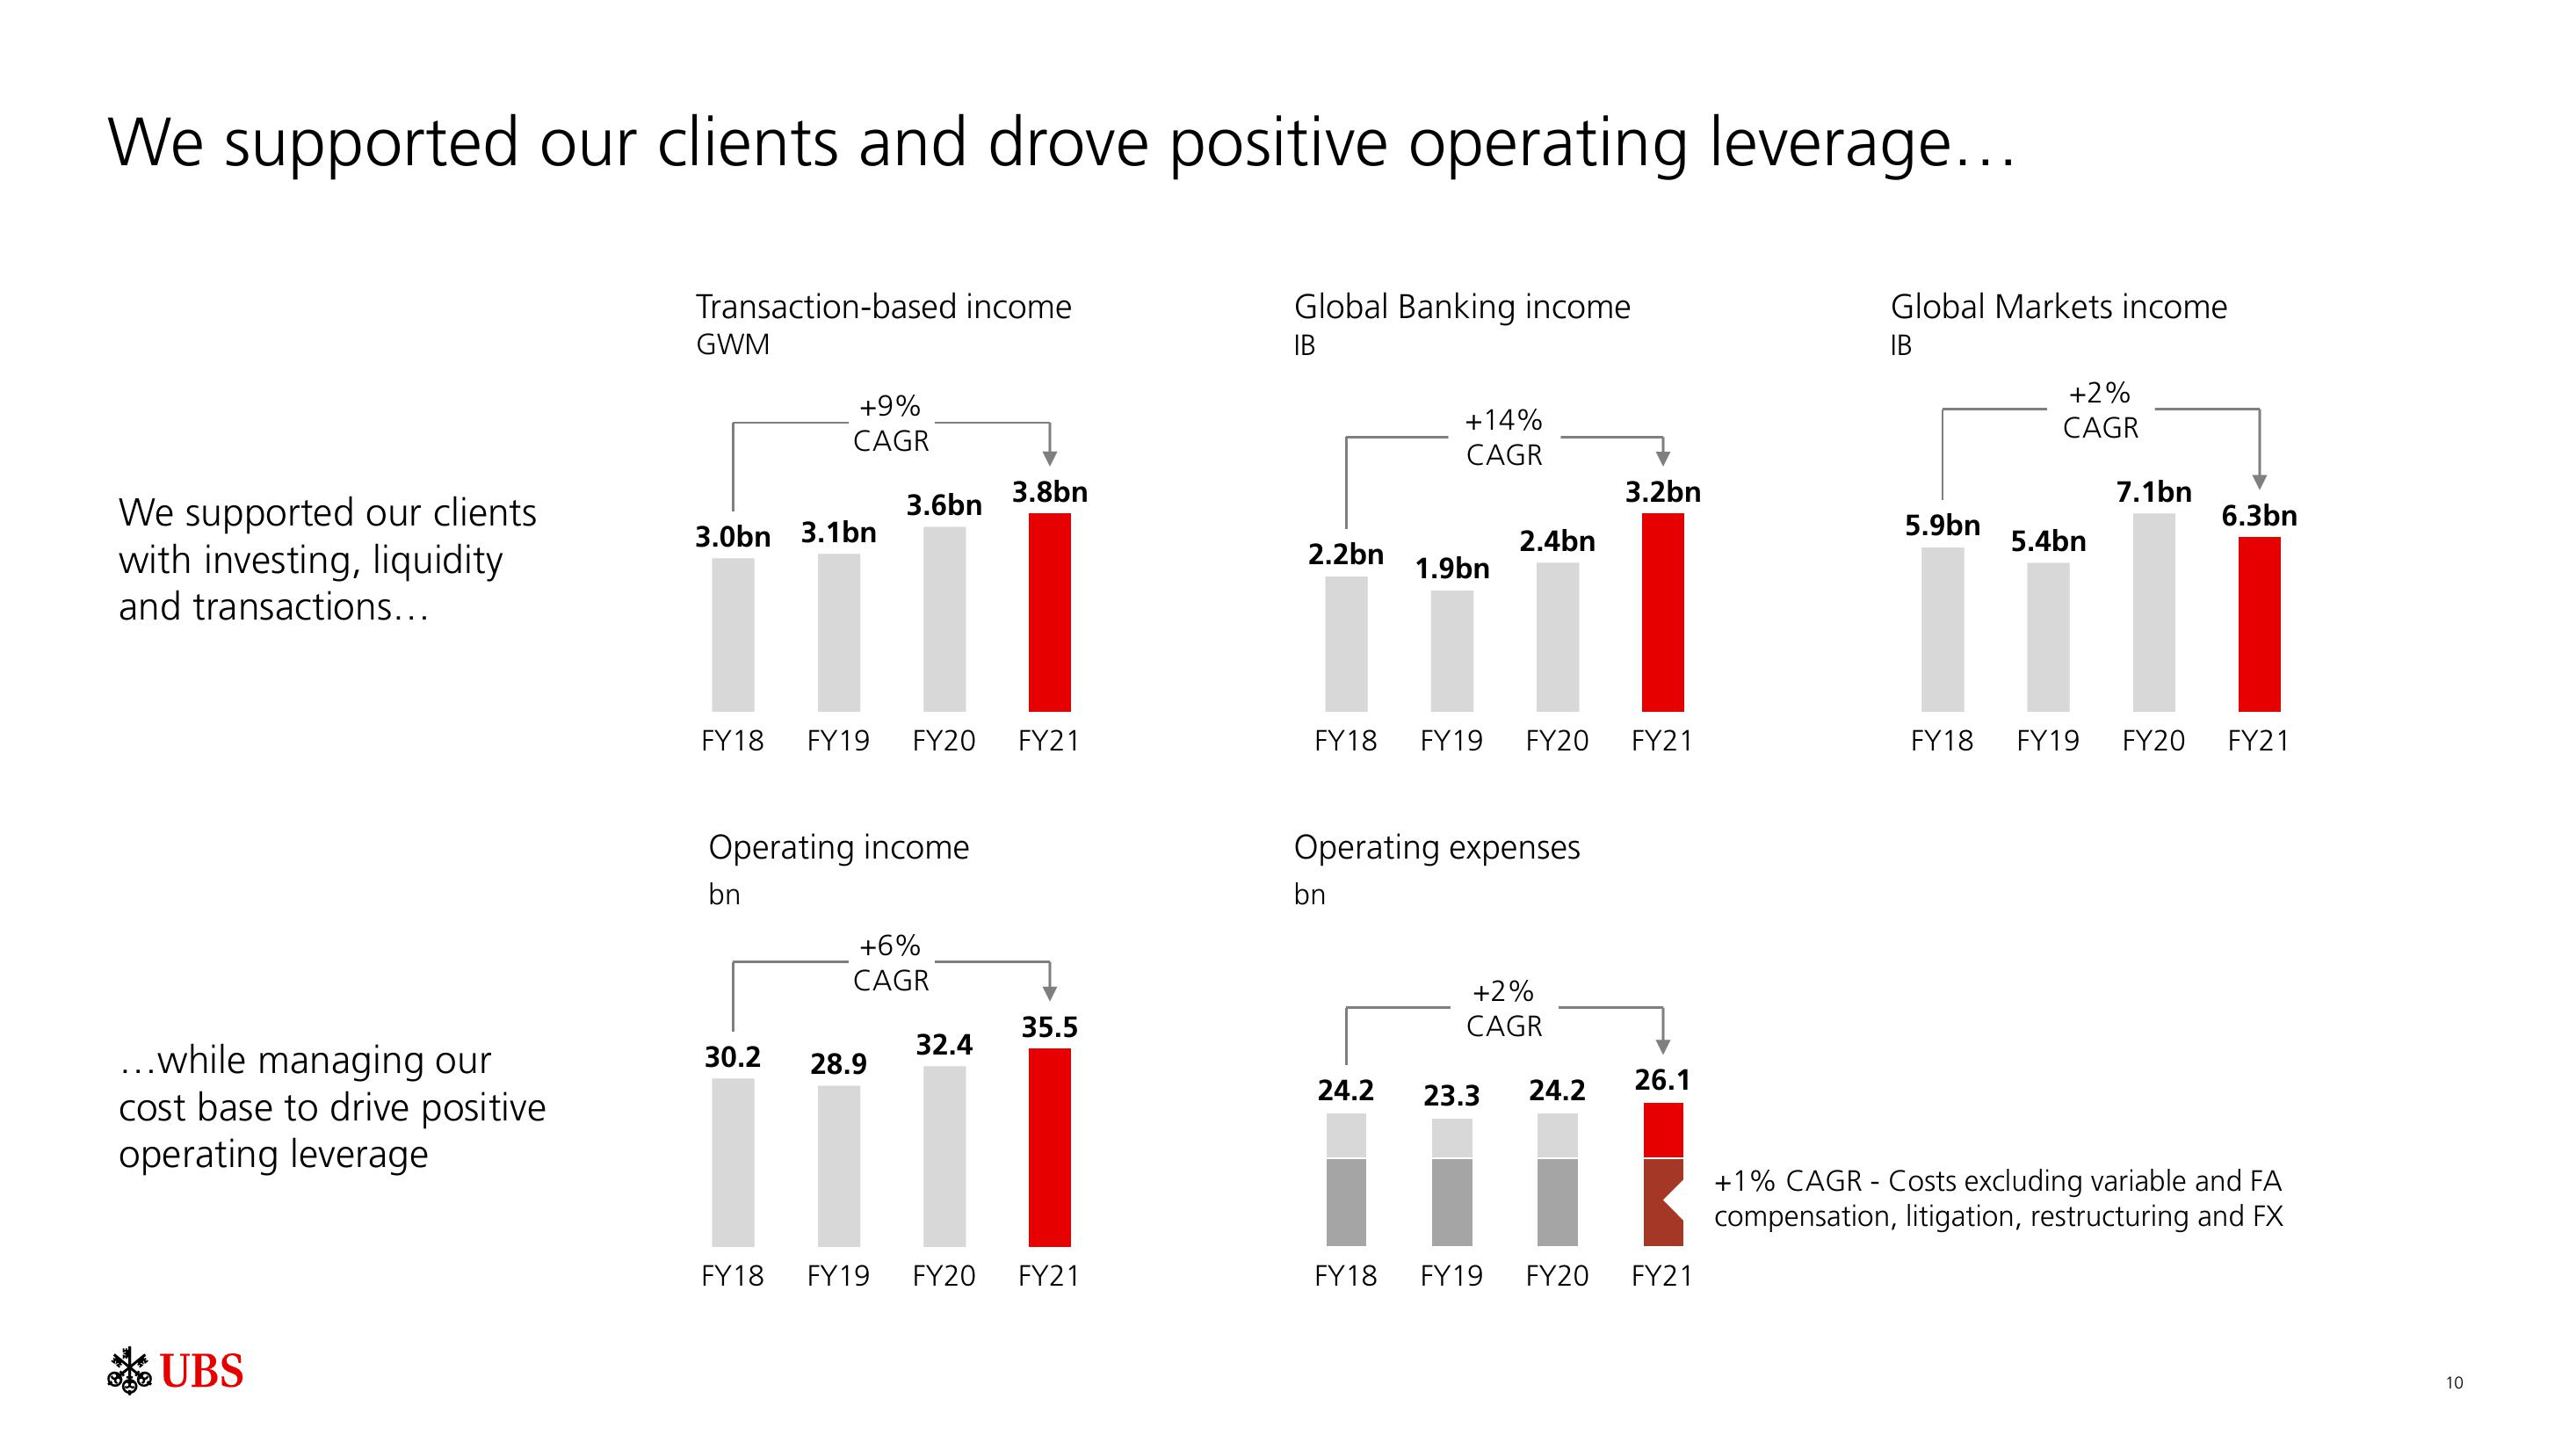
We supported our clients and drove positive operating leverage... Global Banking income IB We supported our clients with investing, liquidity and transactions... ...while managing our cost base to drive positive operating leverage UBS Transaction-based income GWM +9% CAGR 3.6bn 3.0bn 3.1bn 1111 FY18 FY19 FY20 Operating income bn +6% CAGR 30.2 28.9 3.8bn 32.4 FY21 35.5 FY18 FY19 FY20 FY21 2.2bn 2.4bn 1.9bn ITTI FY18 FY19 FY20 FY21 +14% CAGR Operating expenses bn FY18 +2% CAGR 24.2 23.3 24.2 3.2bn FY19 FY20 26.1 [ FY21 Global Markets income IB 5.9bn +2% CAGR 5.4bn 7.1bn 6.3bn FY18 FY19 FY20 FY21 +1% CAGR - Costs excluding variable and FA compensation, litigation, restructuring and FX 10
View entire presentation