Paya SPAC Presentation Deck
Illustrative Transaction Overview
SPAC Cash¹
PIPE
3.
Sources
Sponsor Co-investment
Cash from Balance Sheet
Equity Rollover
Total Sources
Cash to Seller
Total Uses
Uses
Equity Rollover
Fees & Expenses
Sources & Uses
Amount
$353
200
Amount
50
4
480
$1,087
$565
480
42
$1,087
%
%
33%
18%
5%
0%
44%
100%
52%
44%
4%
100%
Pro Forma Valuation
Particulars
PF Shares Outstanding²
Share Price
PF Equity Value
(+) PF Debt
(-) PF Cash
PF Enterprise Value
PF EV/2021E EBITDA
PF EV/2021E Revenue
PF Net Debt/2021E EBITDA
2%
PF Ownership Split
SPAC Investors
31%
Sponsor Promote ³
Sponsor
Co-investment
5%
PIPE
18%
($ in millions)
Amount
Exisiting Paya
Shareholders
44%
110.2
$10.00
$1,102
229
30
$1,300
19.6x
5.5x
3.0x
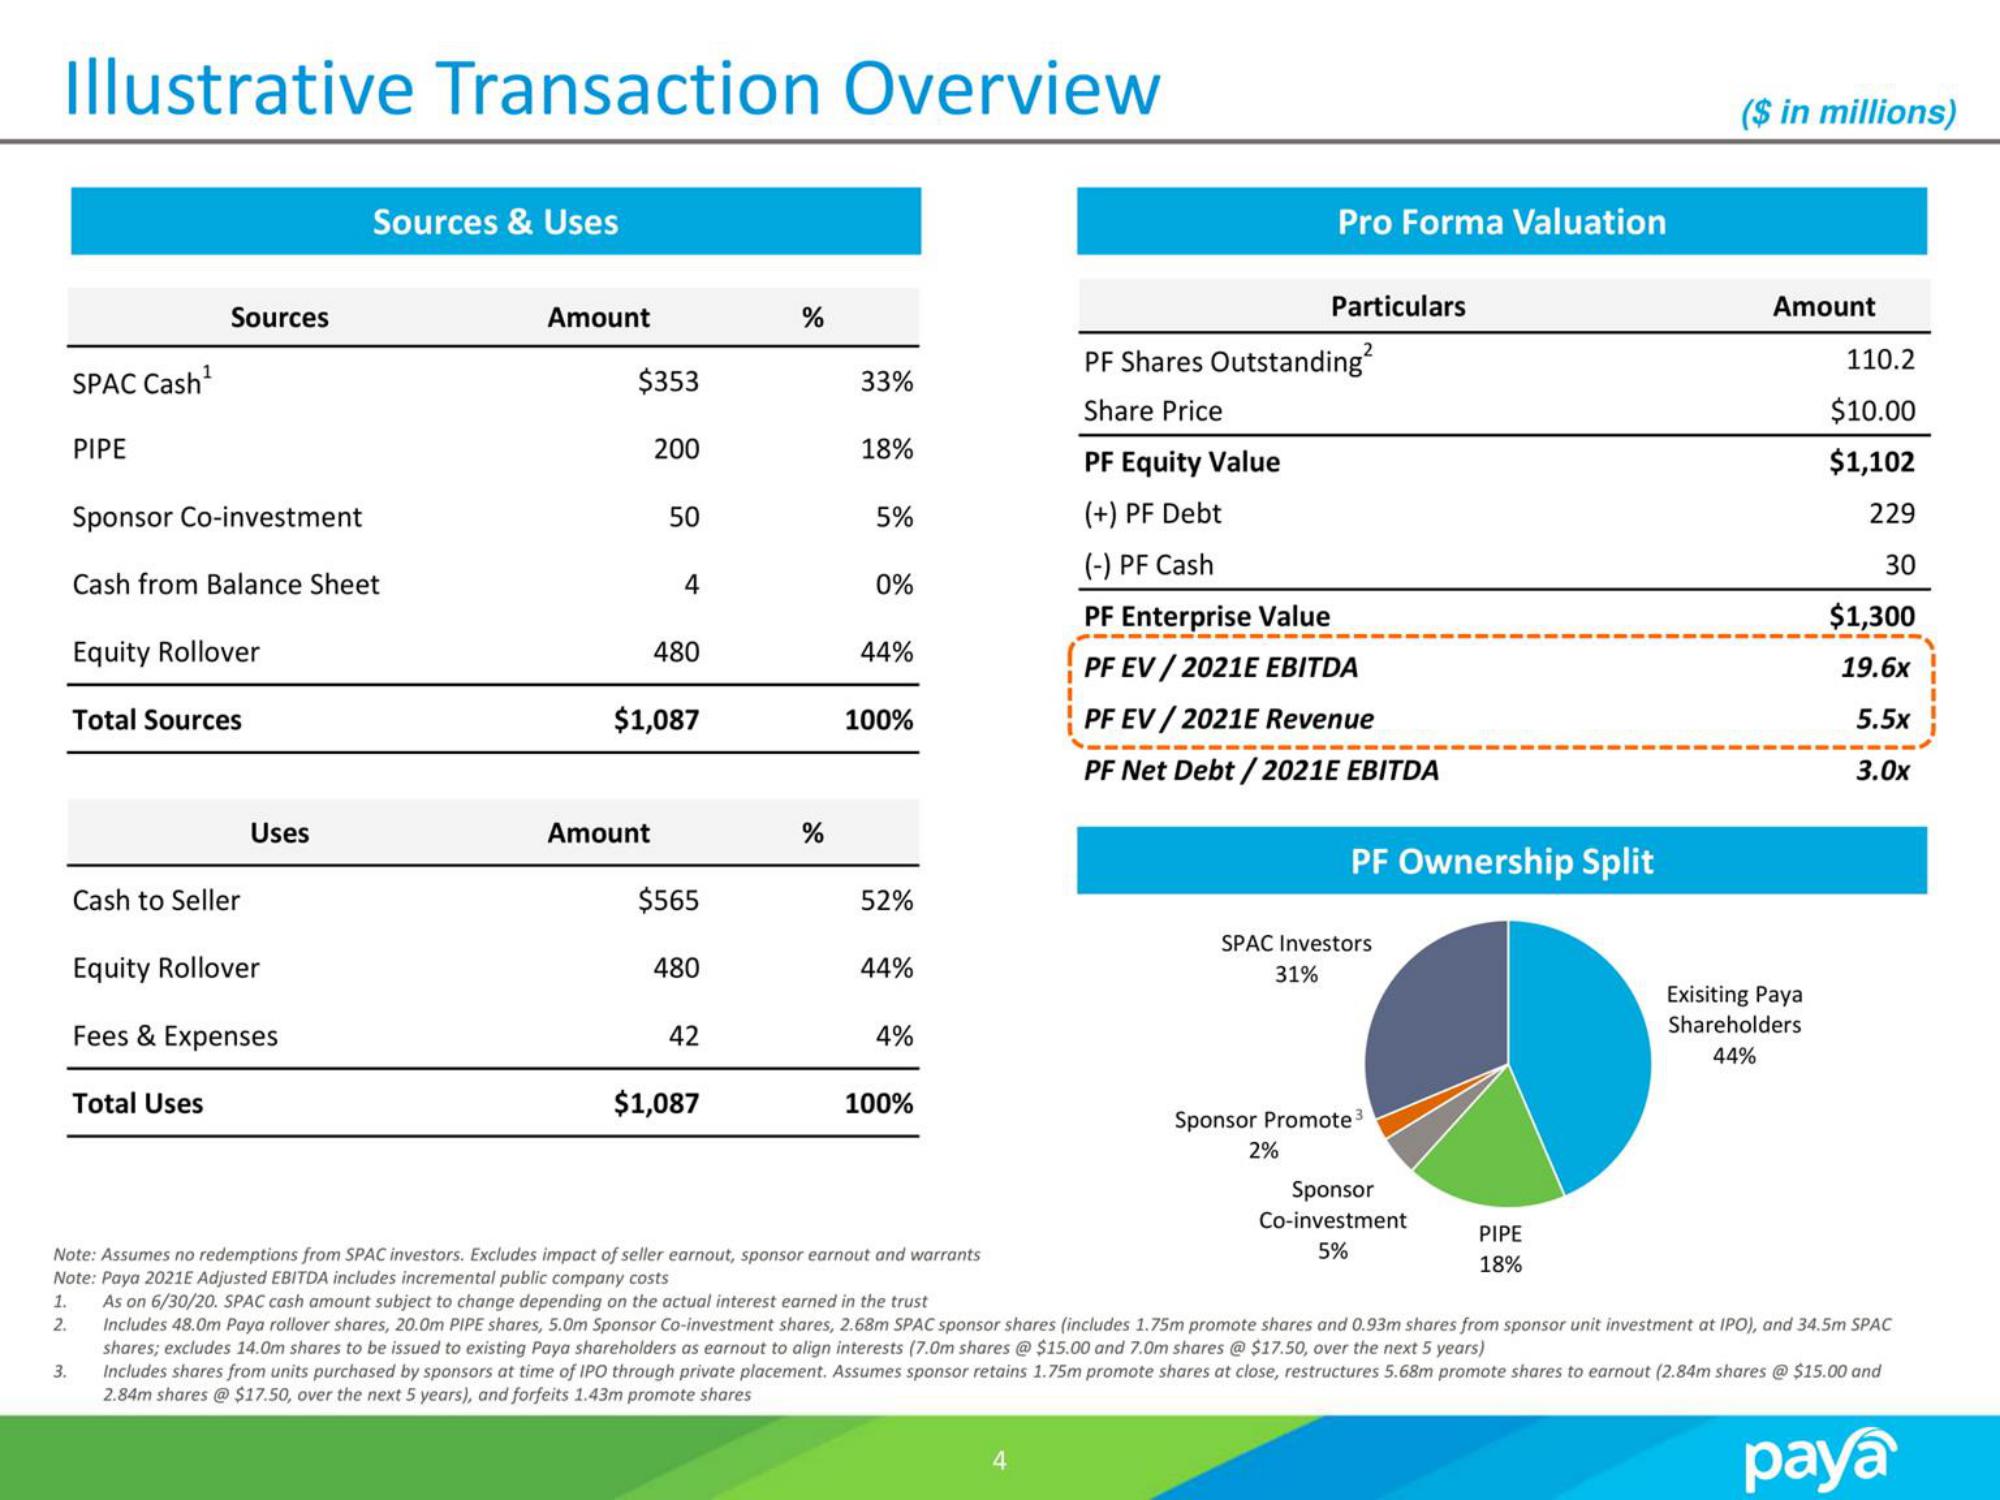
Note: Assumes no redemptions from SPAC investors. Excludes impact of seller earnout, sponsor earnout and warrants
Note: Paya 2021E Adjusted EBITDA includes incremental public company costs
1.
2.
As on 6/30/20. SPAC cash amount subject to change depending on the actual interest earned in the trust
Includes 48.0m Paya rollover shares, 20.0m PIPE shares, 5.0m Sponsor Co-investment shares, 2.68m SPAC sponsor shares (includes 1.75m promote shares and 0.93m shares from sponsor unit investment at IPO), and 34.5m SPAC
shares; excludes 14.0m shares to be issued to existing Paya shareholders as earnout to align interests (7.0m shares @ $15.00 and 7.0m shares @ $17.50, over the next 5 years)
Includes shares from units purchased by sponsors at time of IPO through private placement. Assumes sponsor retains 1.75m promote shares at close, restructures 5.68m promote shares to earnout (2.84m shares @ $15.00 and
2.84m shares @ $17.50, over the next 5 years), and forfeits 1.43m promote shares
payaView entire presentation