Silicon Valley Bank Results Presentation Deck
Healthy markets and strong execution set
stage for continued growth
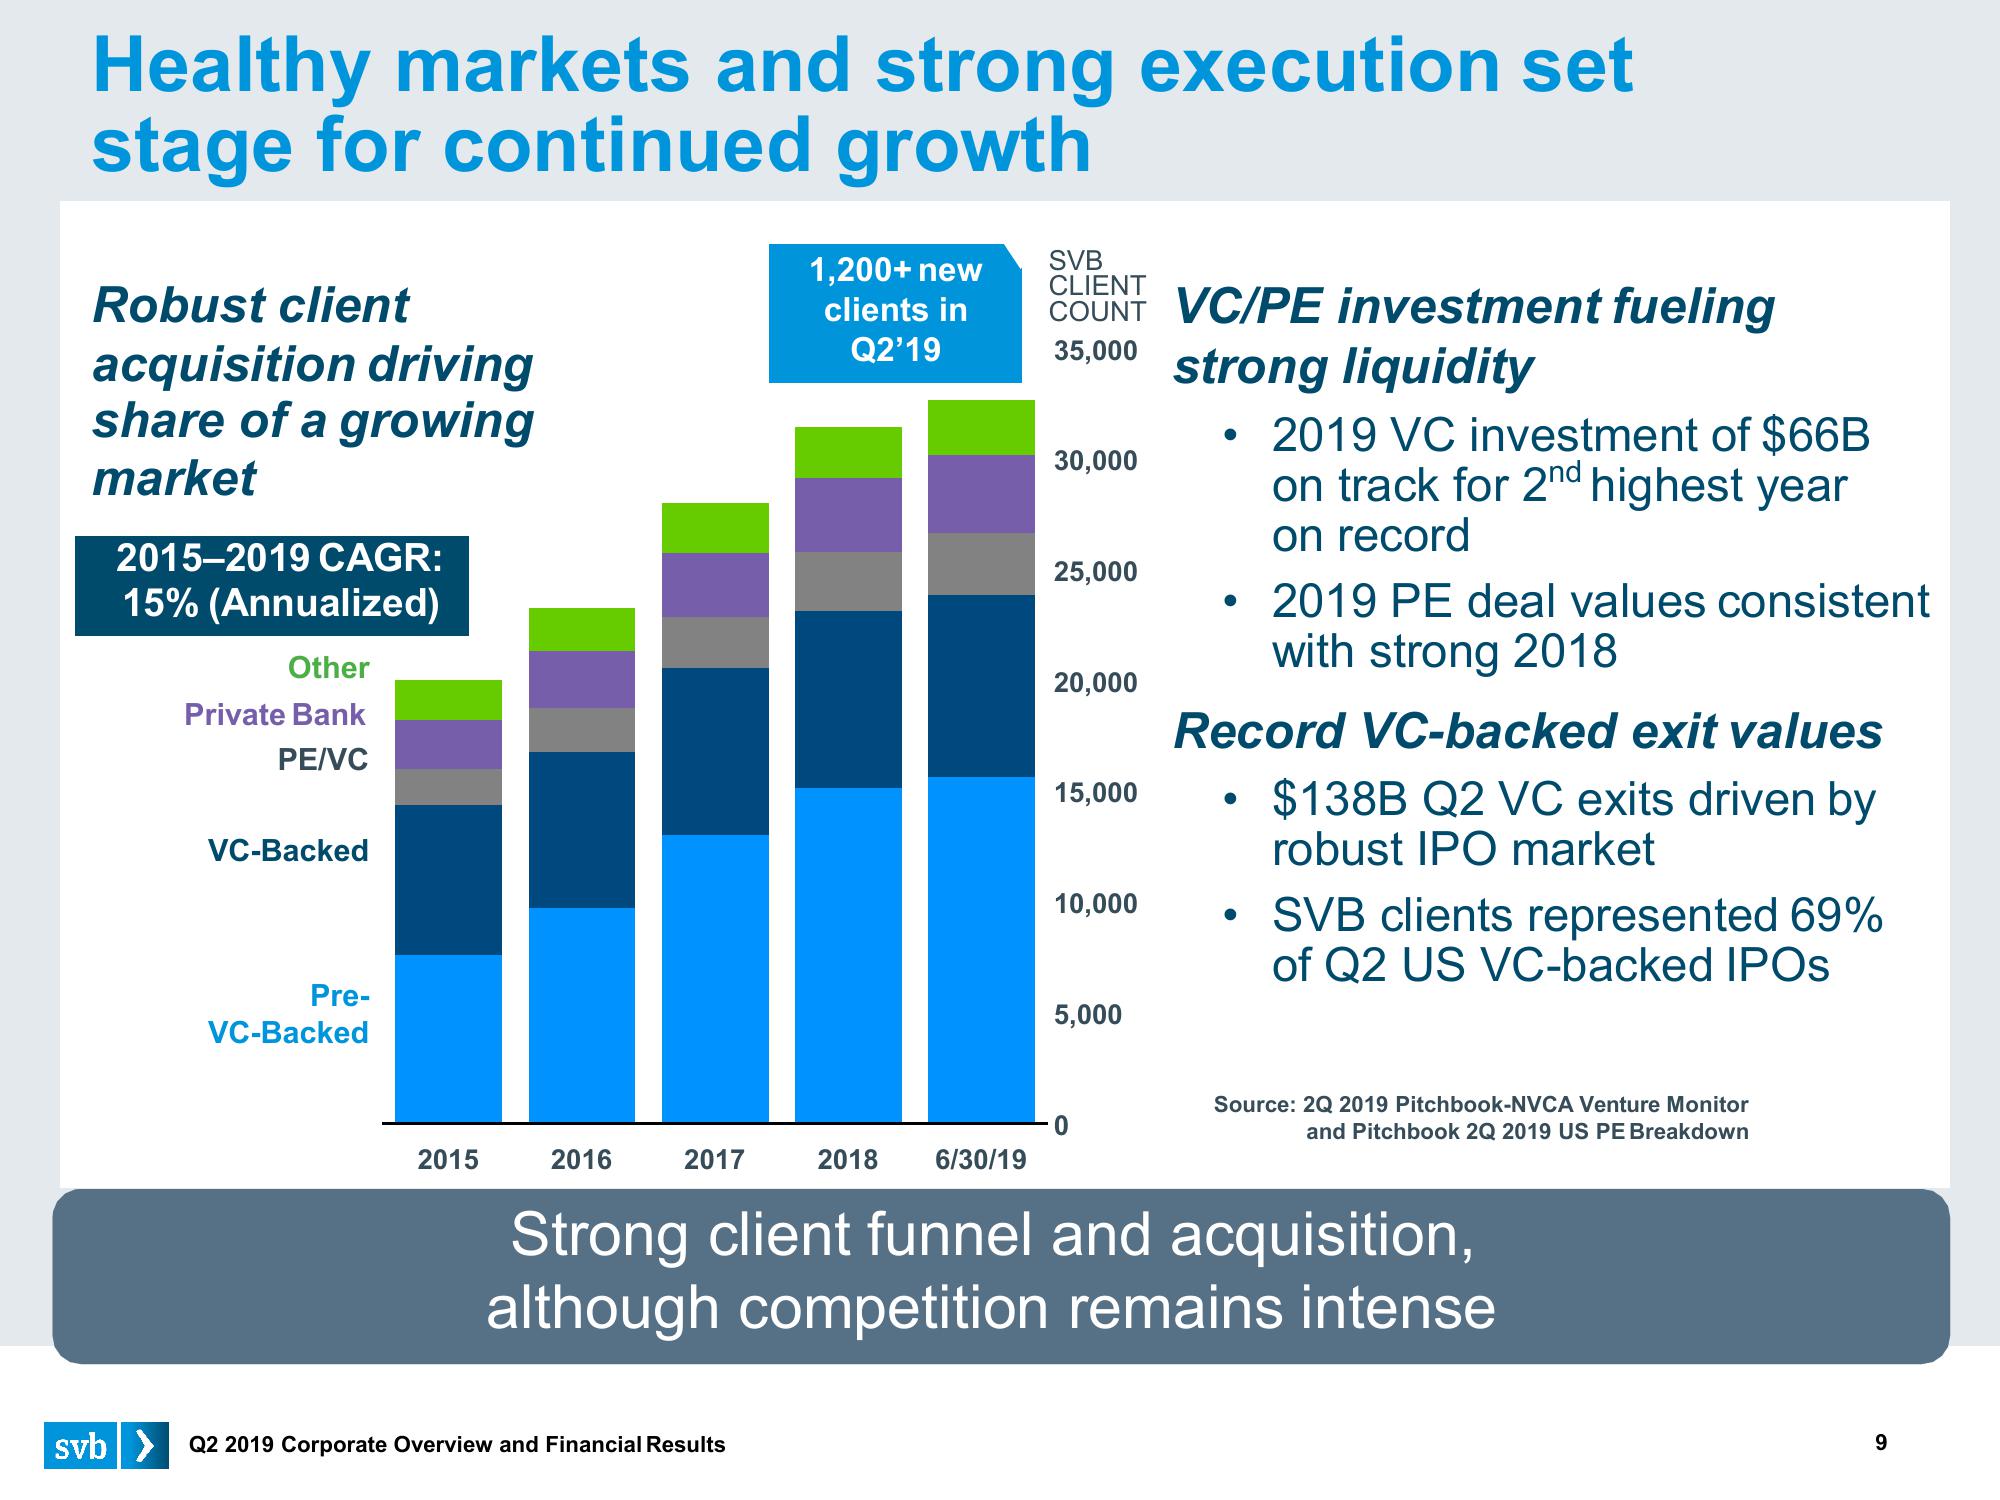
Robust client
acquisition driving
share of a growing
market
2015-2019 CAGR:
15% (Annualized)
Other
Private Bank
PE/VC
VC-Backed
Pre-
VC-Backed
2015
2016
2017
1,200+ new
clients in
Q2'19
svb> Q2 2019 Corporate Overview and Financial Results
2018 6/30/19
SVB
CLIENT
COUNT VC/PE investment fueling
35,000
strong liquidity
30,000
25,000
20,000
15,000
10,000
5,000
0
●
●
●
2019 VC investment of $66B
on track for 2nd highest year
on record
Record VC-backed exit values
$138B Q2 VC exits driven by
robust IPO market
●
2019 PE deal values consistent
with strong 2018
SVB clients represented 69%
of Q2 US VC-backed IPOs
Source: 2Q 2019 Pitchbook-NVCA Venture Monitor
and Pitchbook 2Q 2019 US PE Breakdown
Strong client funnel and acquisition,
although competition remains intense
9View entire presentation