BlackRock Results Presentation Deck
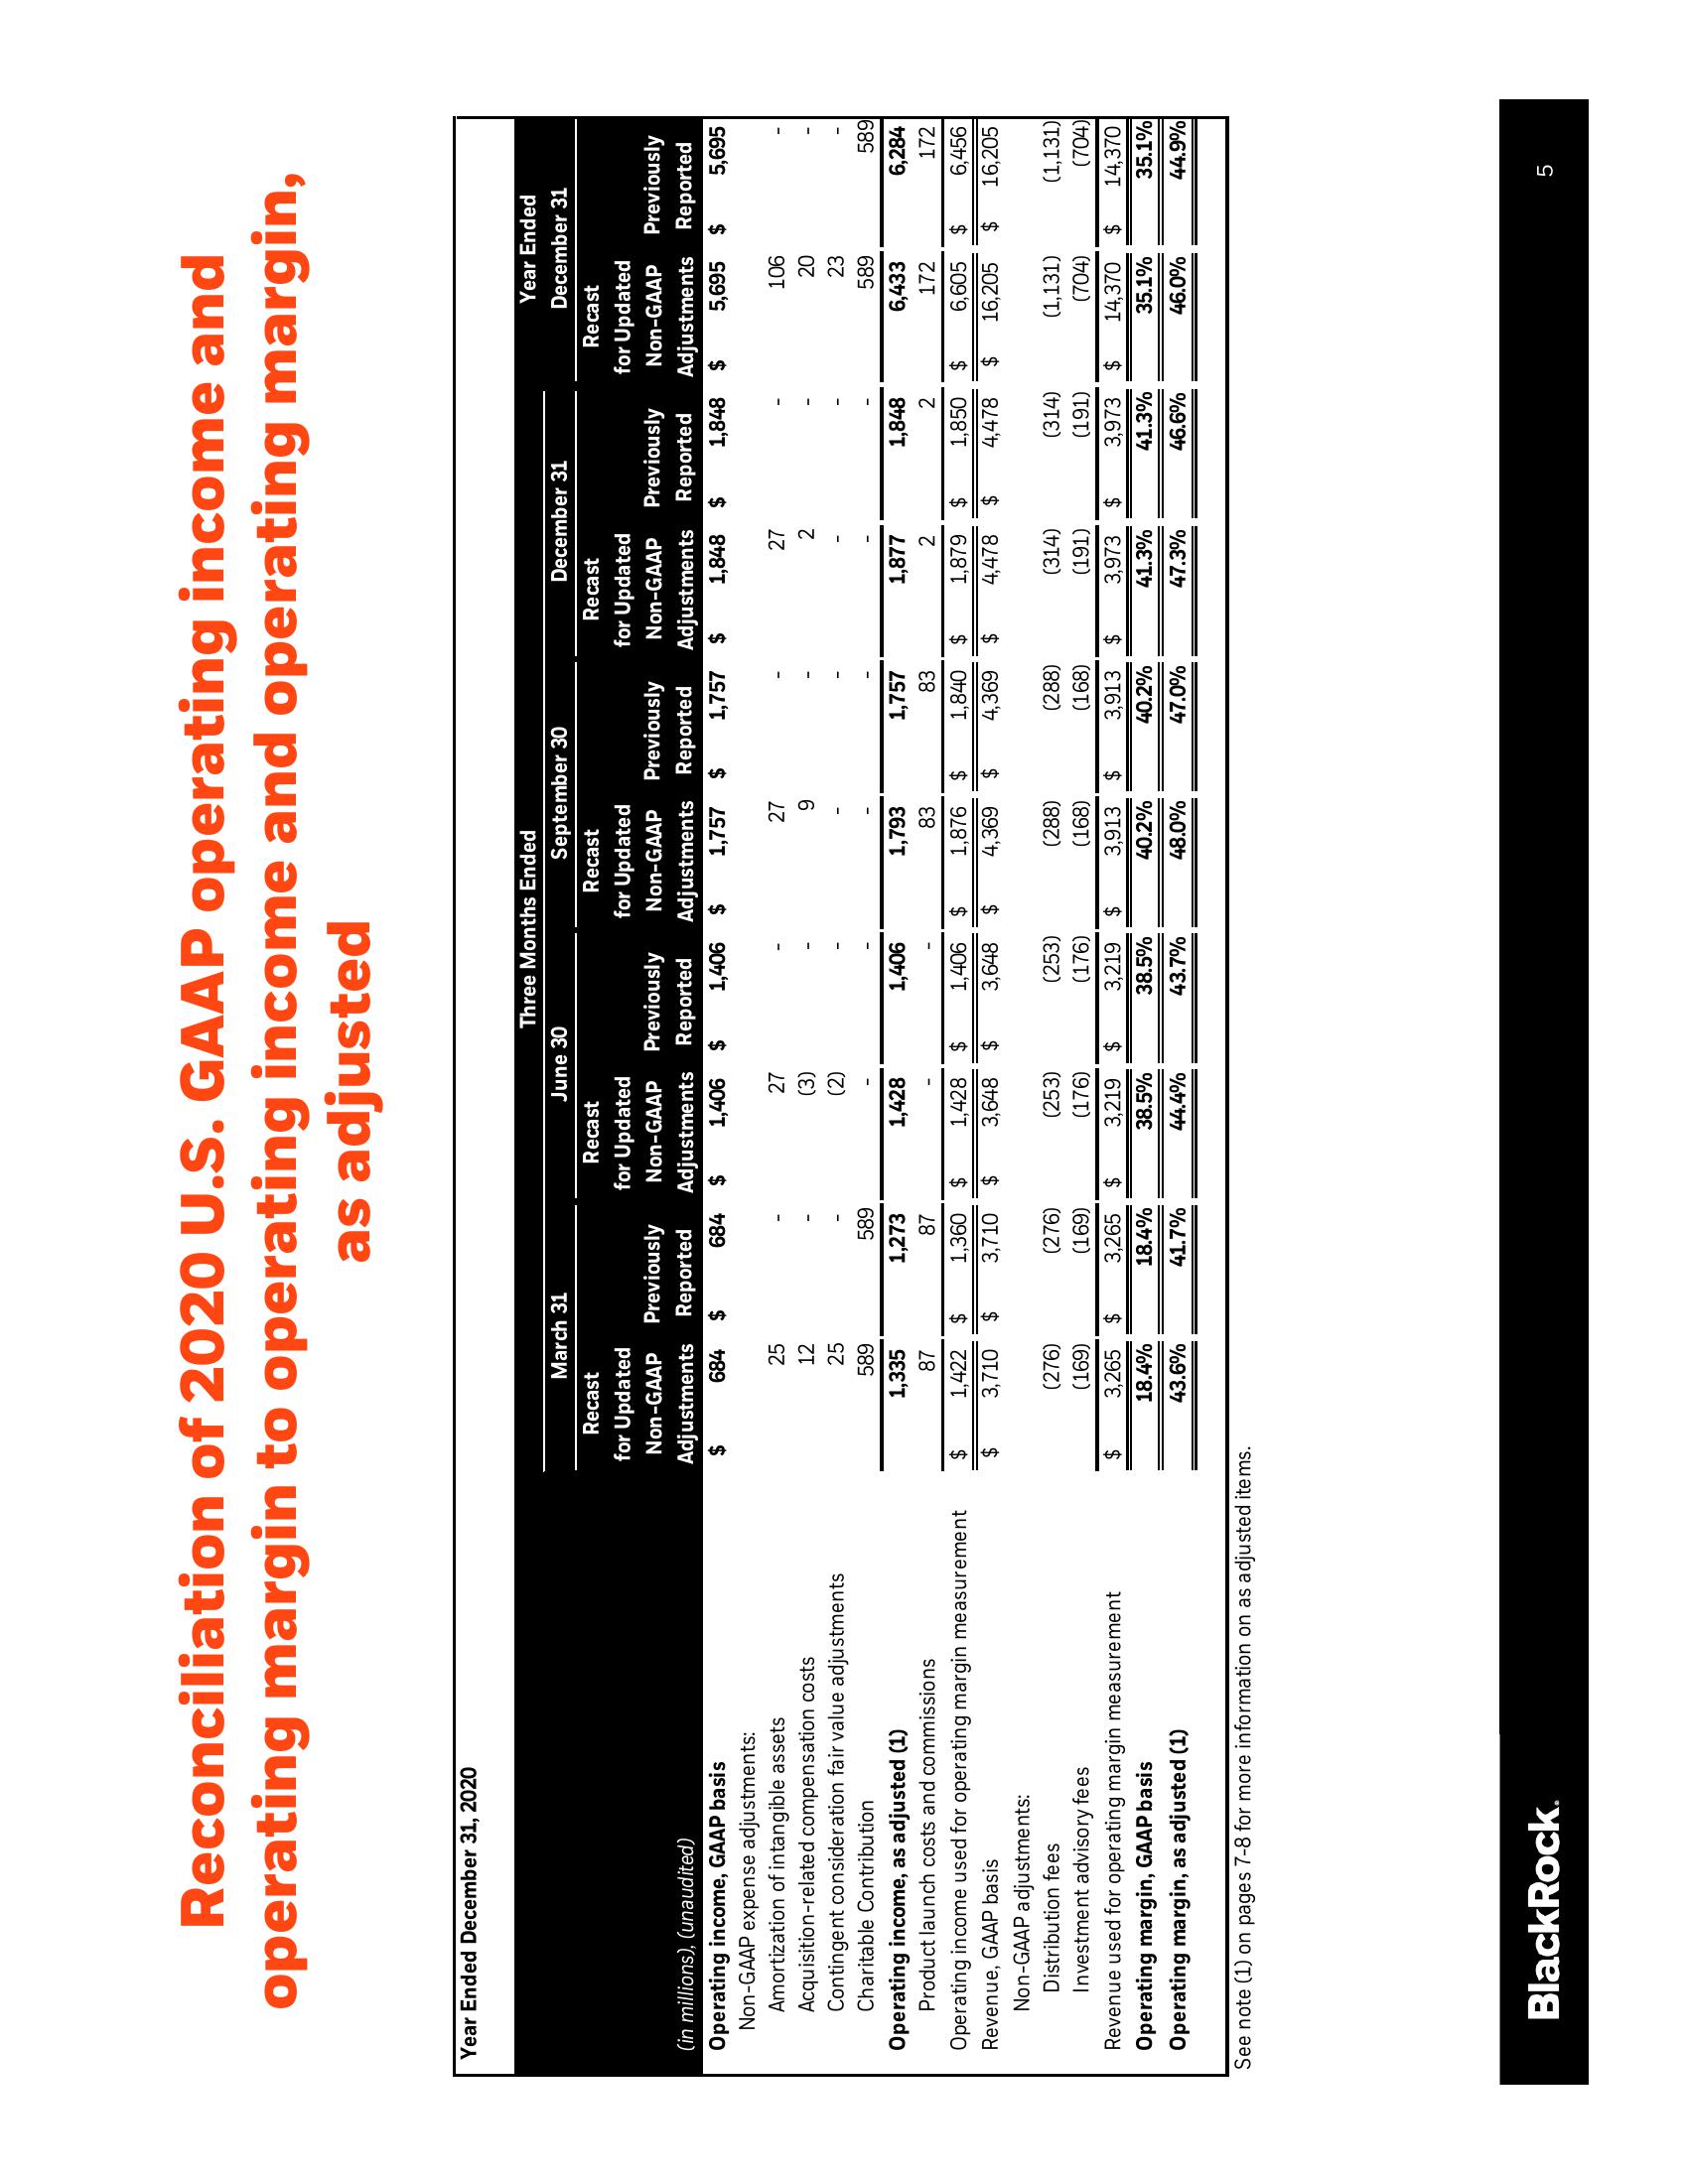
Reconciliation of 2020 U.S. GAAP operating income and
operating margin to operating income and operating margin,
as adjusted
Year Ended December 31, 2020
(in millions), (unaudited)
Operating income, GAAP basis
Non-GAAP expense adjustments:
Amortization of intangible assets
Acquisition-related compensation costs
Contingent consideration fair value adjustments
Charitable Contribution
Operating income, as adjusted (1)
Product launch costs and commissions
Operating income used for operating margin measurement
Revenue, GAAP basis
Non-GAAP adjustments:
Distribution fees
Investment advisory fees
Revenue used for operating margin measurement
Operating margin, GAAP basis
Operating margin, as adjusted (1)
BlackRock.
Recast
for Updated
Non-GAAP Previously
Adjustments Reported
684 $
$
$
$
$
See note (1) on pages 7-8 for more information on as adjusted items.
March 31
25
12
25
589
1,335
87
1,422 $
3,710 $
(276)
(169)
3,265
18.4%
43.6%
$
589
1,273
87
1,360 $
3,710 $
(276)
(169)
3,265
18.4%
41.7%
$
June 30
Recast
Recast
Recast
for Updated
for Updated
for Updated
Non-GAAP Previously
Non-GAAP Previously Non-GAAP Previously
Adjustments Reported
Adjustments Reported Adjustments Reported
684 $ 1,406 $ 1,406 $ 1,757 $ 1,757 $ 1,848 $ 1,848 $ 5,695 $ 5,695
27
(3)
(2)
1,428
1,428 $
3,648 $
(253)
(176)
Three Months Ended
3,219
38.5%
44.4%
$
1,406
1,406
3,648
(253)
(176)
3,219
38.5%
43.7%
Recast
for Updated
Non-GAAP Previously
Adjustments Reported
$
September 30
$
$
27
9
1,793
83
1,876 $
4,369 $
(288)
(168)
3,913
40.2%
48.0%
$
1,757
83
1,840 $
4,369
$
December 31
(288)
(168)
3,913 $
40.2%
47.0%
27
2
1,877
2
1,879 $
4,478
$
(314)
(191)
3,973
41.3%
47.3%
$
1,848
2
1,850 $
4,478 $
(314)
(191)
Year Ended
December 31
3,973
41.3%
46.6%
106
20
23
589
6,433
172
6,284
172
6,605 $ 6,456
16,205 $ 16,205
(1,131)
(704)
589
(1,131)
(704)
$ 14,370 $ 14,370
35.1%
35.1%
46.0%
44.9%
5View entire presentation