1Q20 Investor Update
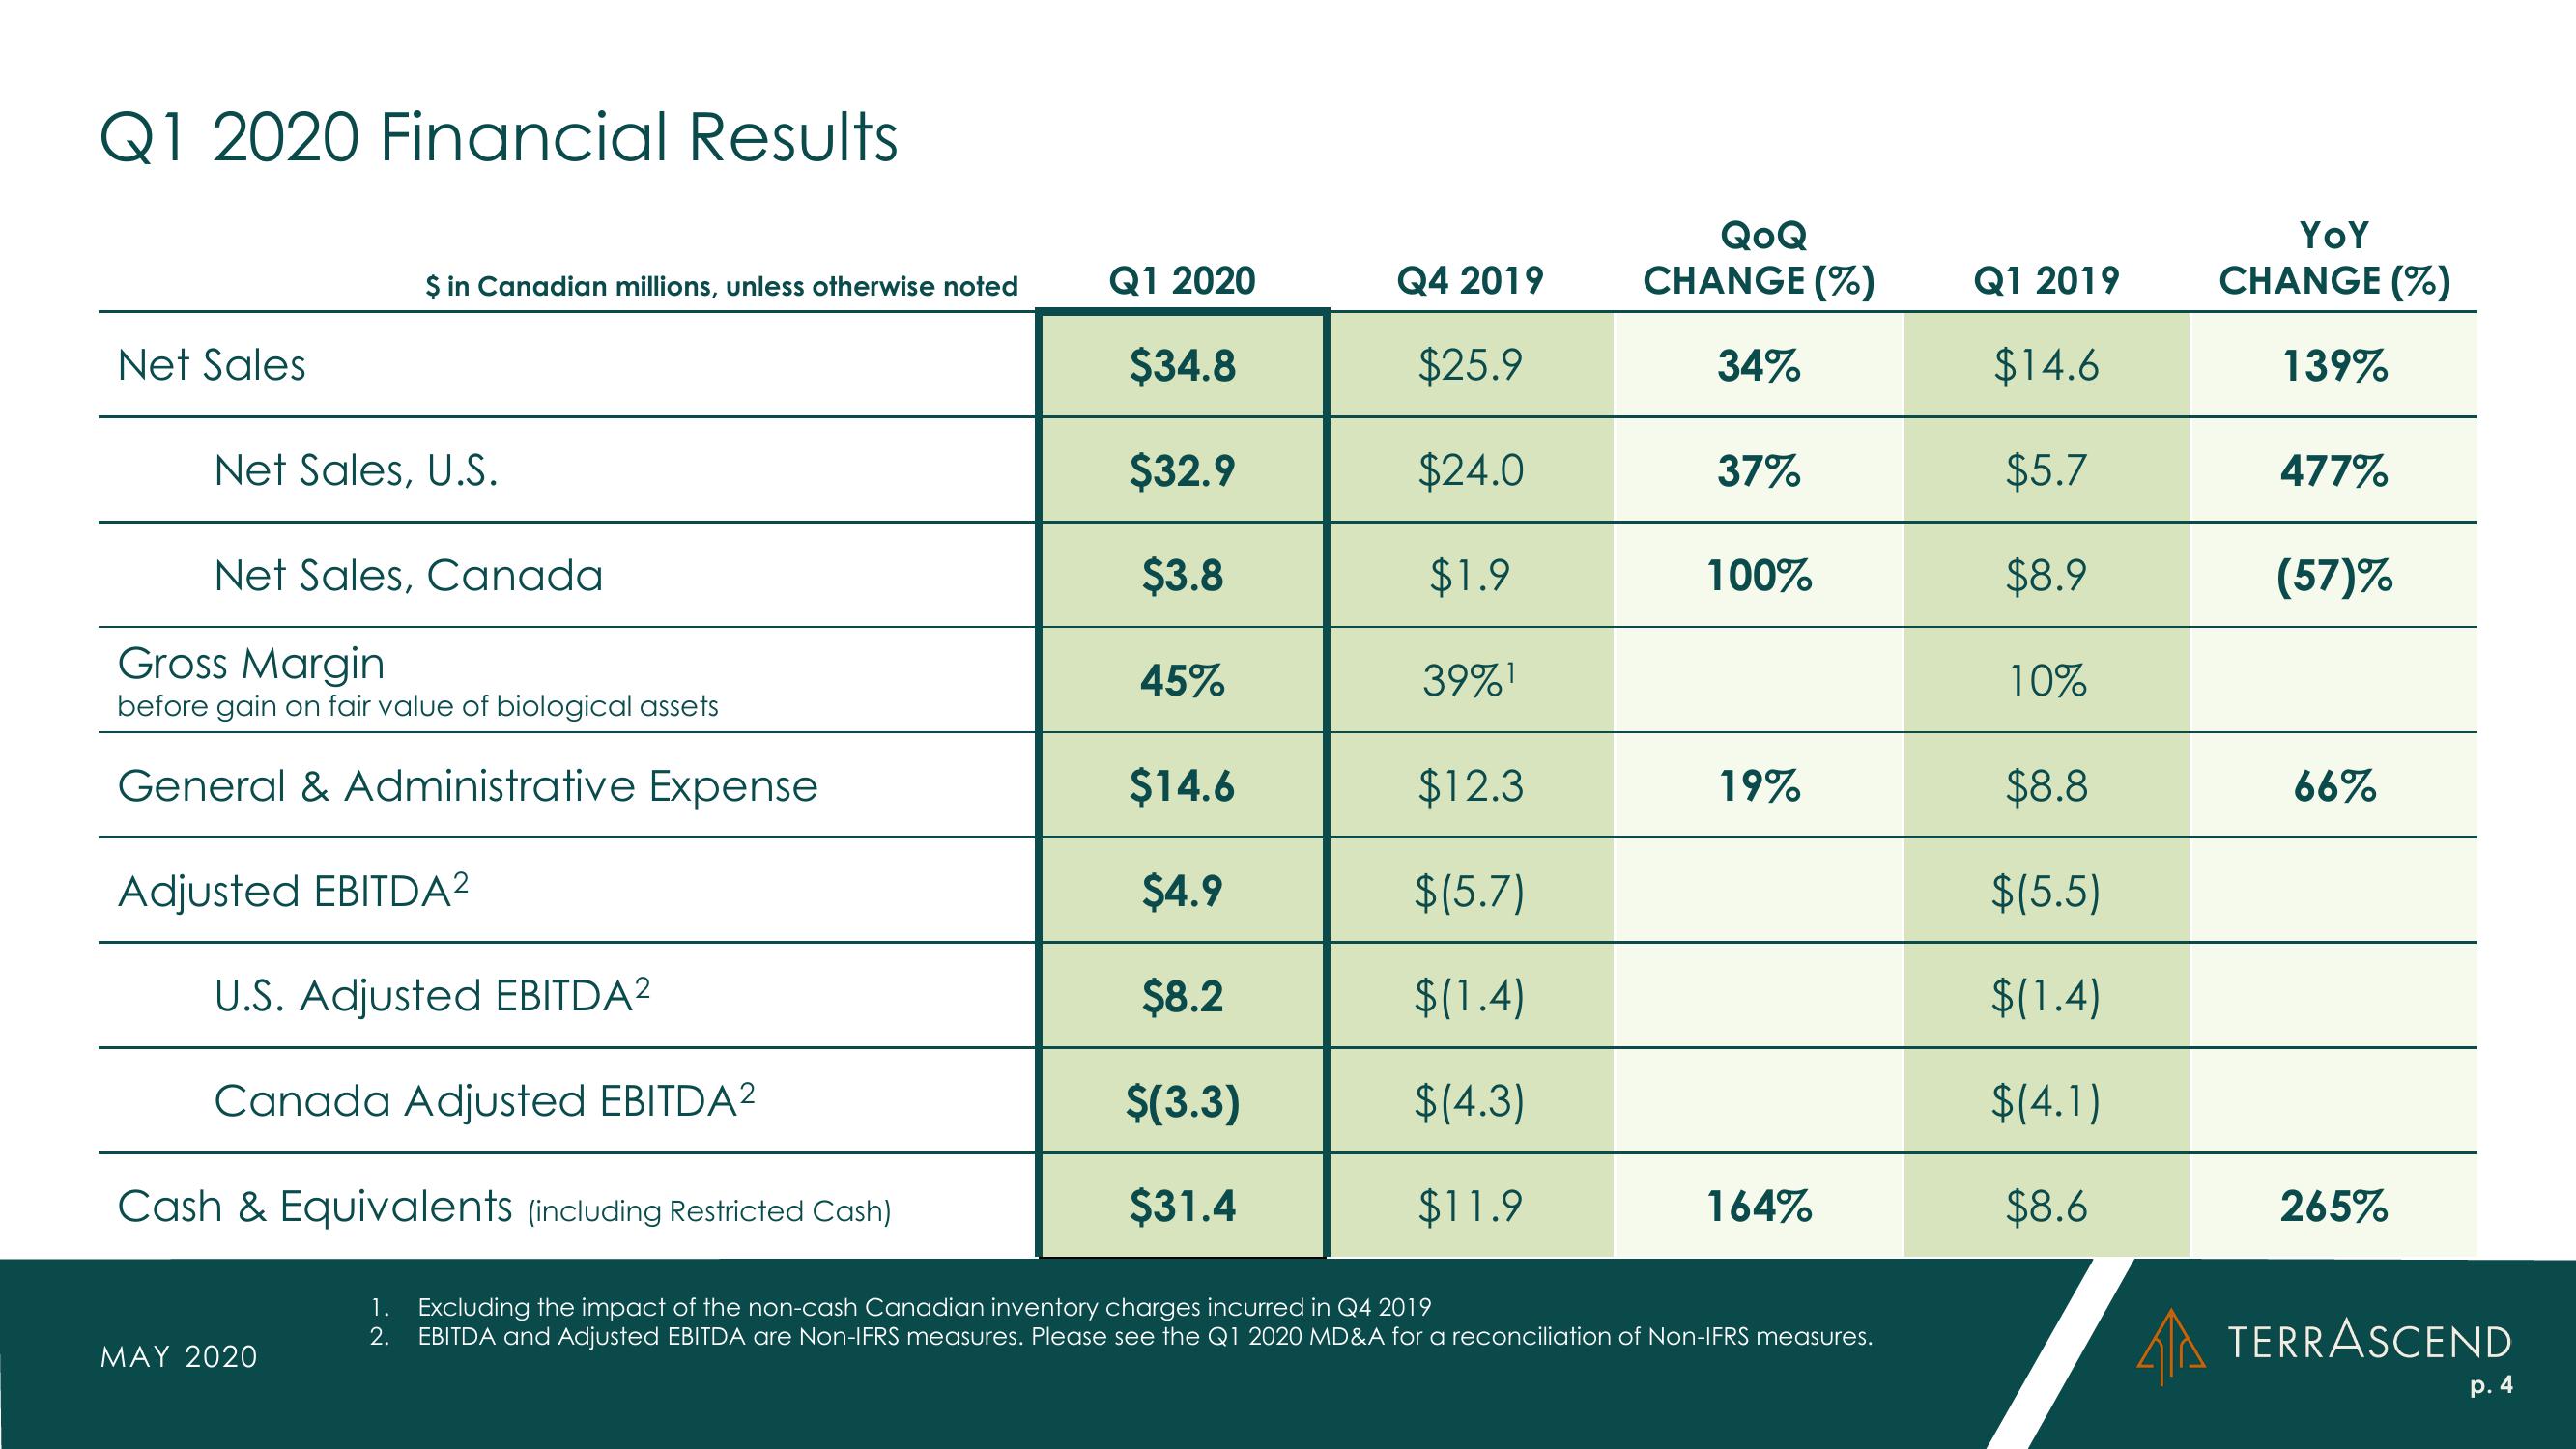
Q1 2020 Financial Results
Net Sales
$ in Canadian millions, unless otherwise noted
Net Sales, U.S.
Net Sales, Canada
Gross Margin
before gain on fair value of biological assets
General & Administrative Expense
Adjusted EBITDA²
U.S. Adjusted EBITDA²
Canada Adjusted EBITDA²
Cash & Equivalents (including Restricted Cash)
MAY 2020
Q1 2020
$34.8
$32.9
$3.8
45%
$14.6
$4.9
$8.2
$(3.3)
$31.4
Q4 2019
$25.9
$24.0
$1.9
39%¹
$12.3
$(5.7)
$(1.4)
$(4.3)
$11.9
QoQ
CHANGE (%)
34%
37%
100%
19%
164%
1. Excluding the impact of the non-cash Canadian inventory charges incurred in Q4 2019
2. EBITDA and Adjusted EBITDA are Non-IFRS measures. Please see the Q1 2020 MD&A for a reconciliation of Non-IFRS measures.
Q1 2019
$14.6
$5.7
$8.9
10%
$8.8
$(5.5)
$(1.4)
$(4.1)
$8.6
YoY
CHANGE (%)
139%
477%
(57)%
66%
265%
4 TERRASCEND
p. 4View entire presentation