Investor Presentation
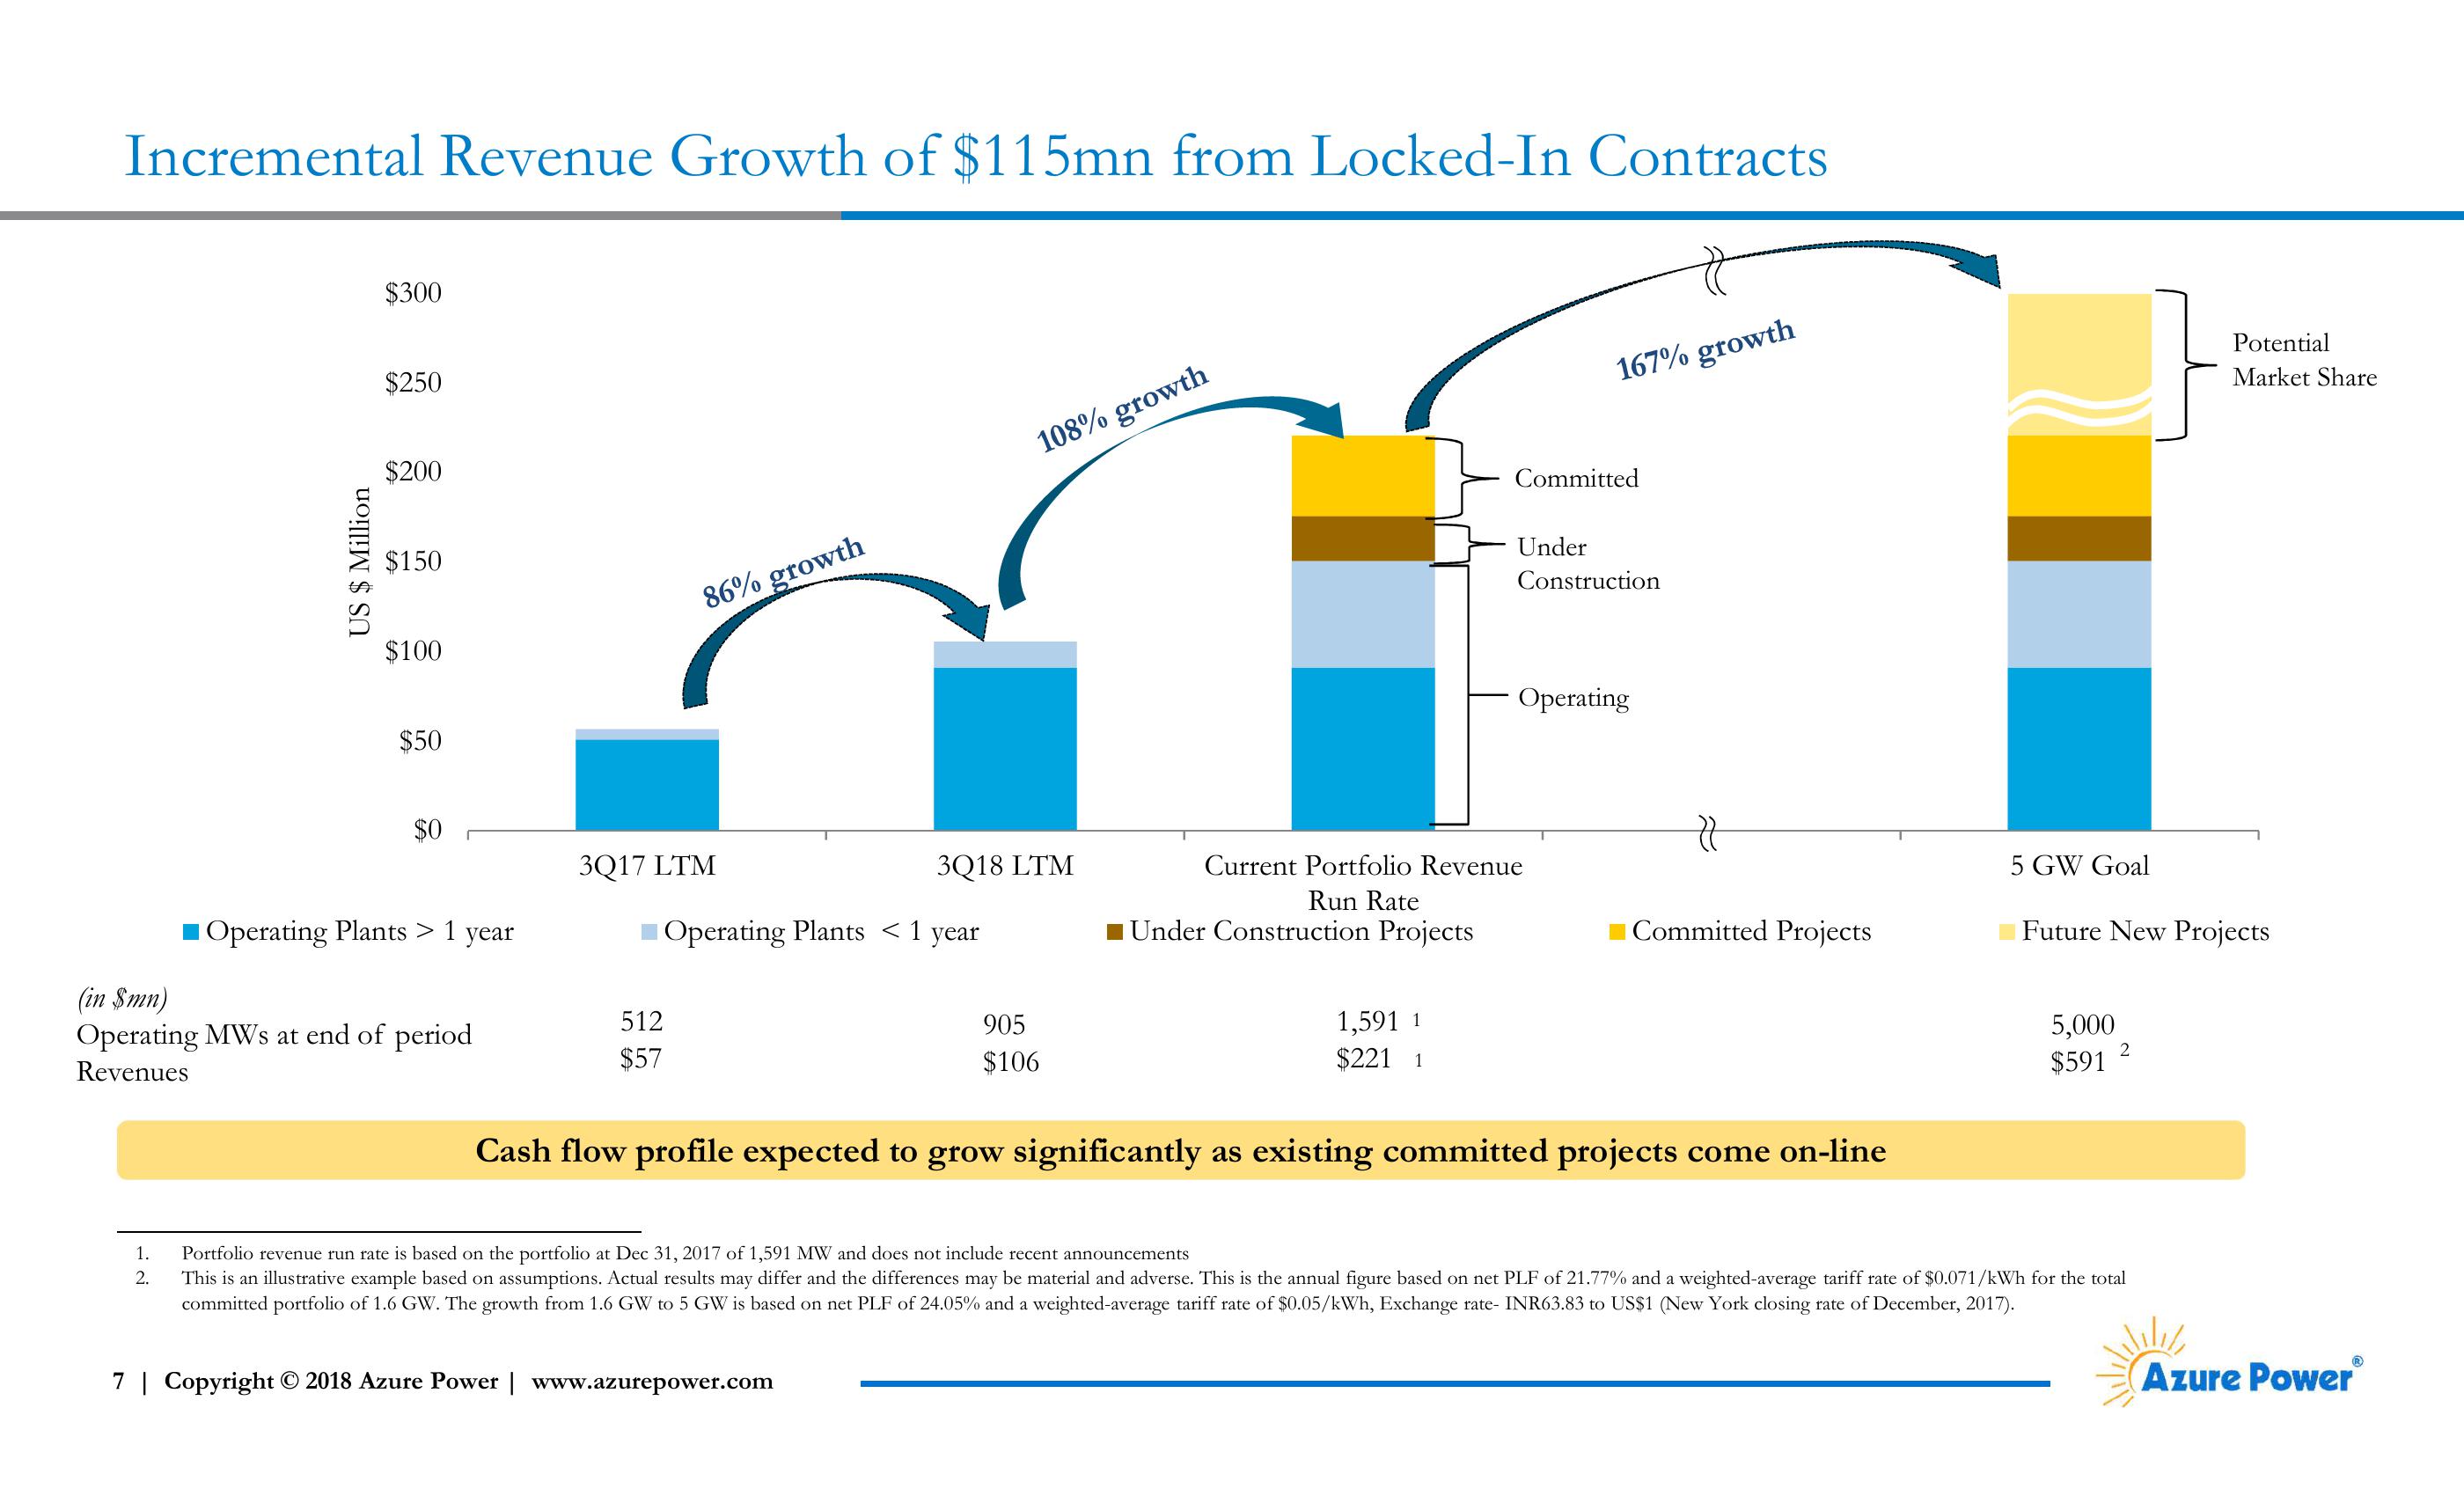
Incremental Revenue Growth of $115mn from Locked-In Contracts
US $ Million
$300
$250
$200
108% growth
$150
$100
86% growth
$50
$0
167% growth
Committed
Under
Construction
Operating
3Q17 LTM
3Q18 LTM
Current Portfolio Revenue
5 GW Goal
(in $mn)
Operating Plants > 1 year
Operating Plants < 1 year
Run Rate
Under Construction Projects
Committed Projects
Future New Projects
512
Operating MWs at end of period
$57
Revenues
905
$106
1,591 1
$221 1
5,000
$591 2
Cash flow profile expected to grow significantly as existing committed projects come on-line
1.
2.
Portfolio revenue run rate is based on the portfolio at Dec 31, 2017 of 1,591 MW and does not include recent announcements
This is an illustrative example based on assumptions. Actual results may differ and the differences may be material and adverse. This is the annual figure based on net PLF of 21.77% and a weighted-average tariff rate of $0.071/kWh for the total
committed portfolio of 1.6 GW. The growth from 1.6 GW to 5 GW is based on net PLF of 24.05% and a weighted-average tariff rate of $0.05/kWh, Exchange rate- INR63.83 to US$1 (New York closing rate of December, 2017).
7 | Copyright © 2018 Azure Power | www.azurepower.com
Potential
Market Share
Azure PowerView entire presentation