LionTree Investment Banking Pitch Book
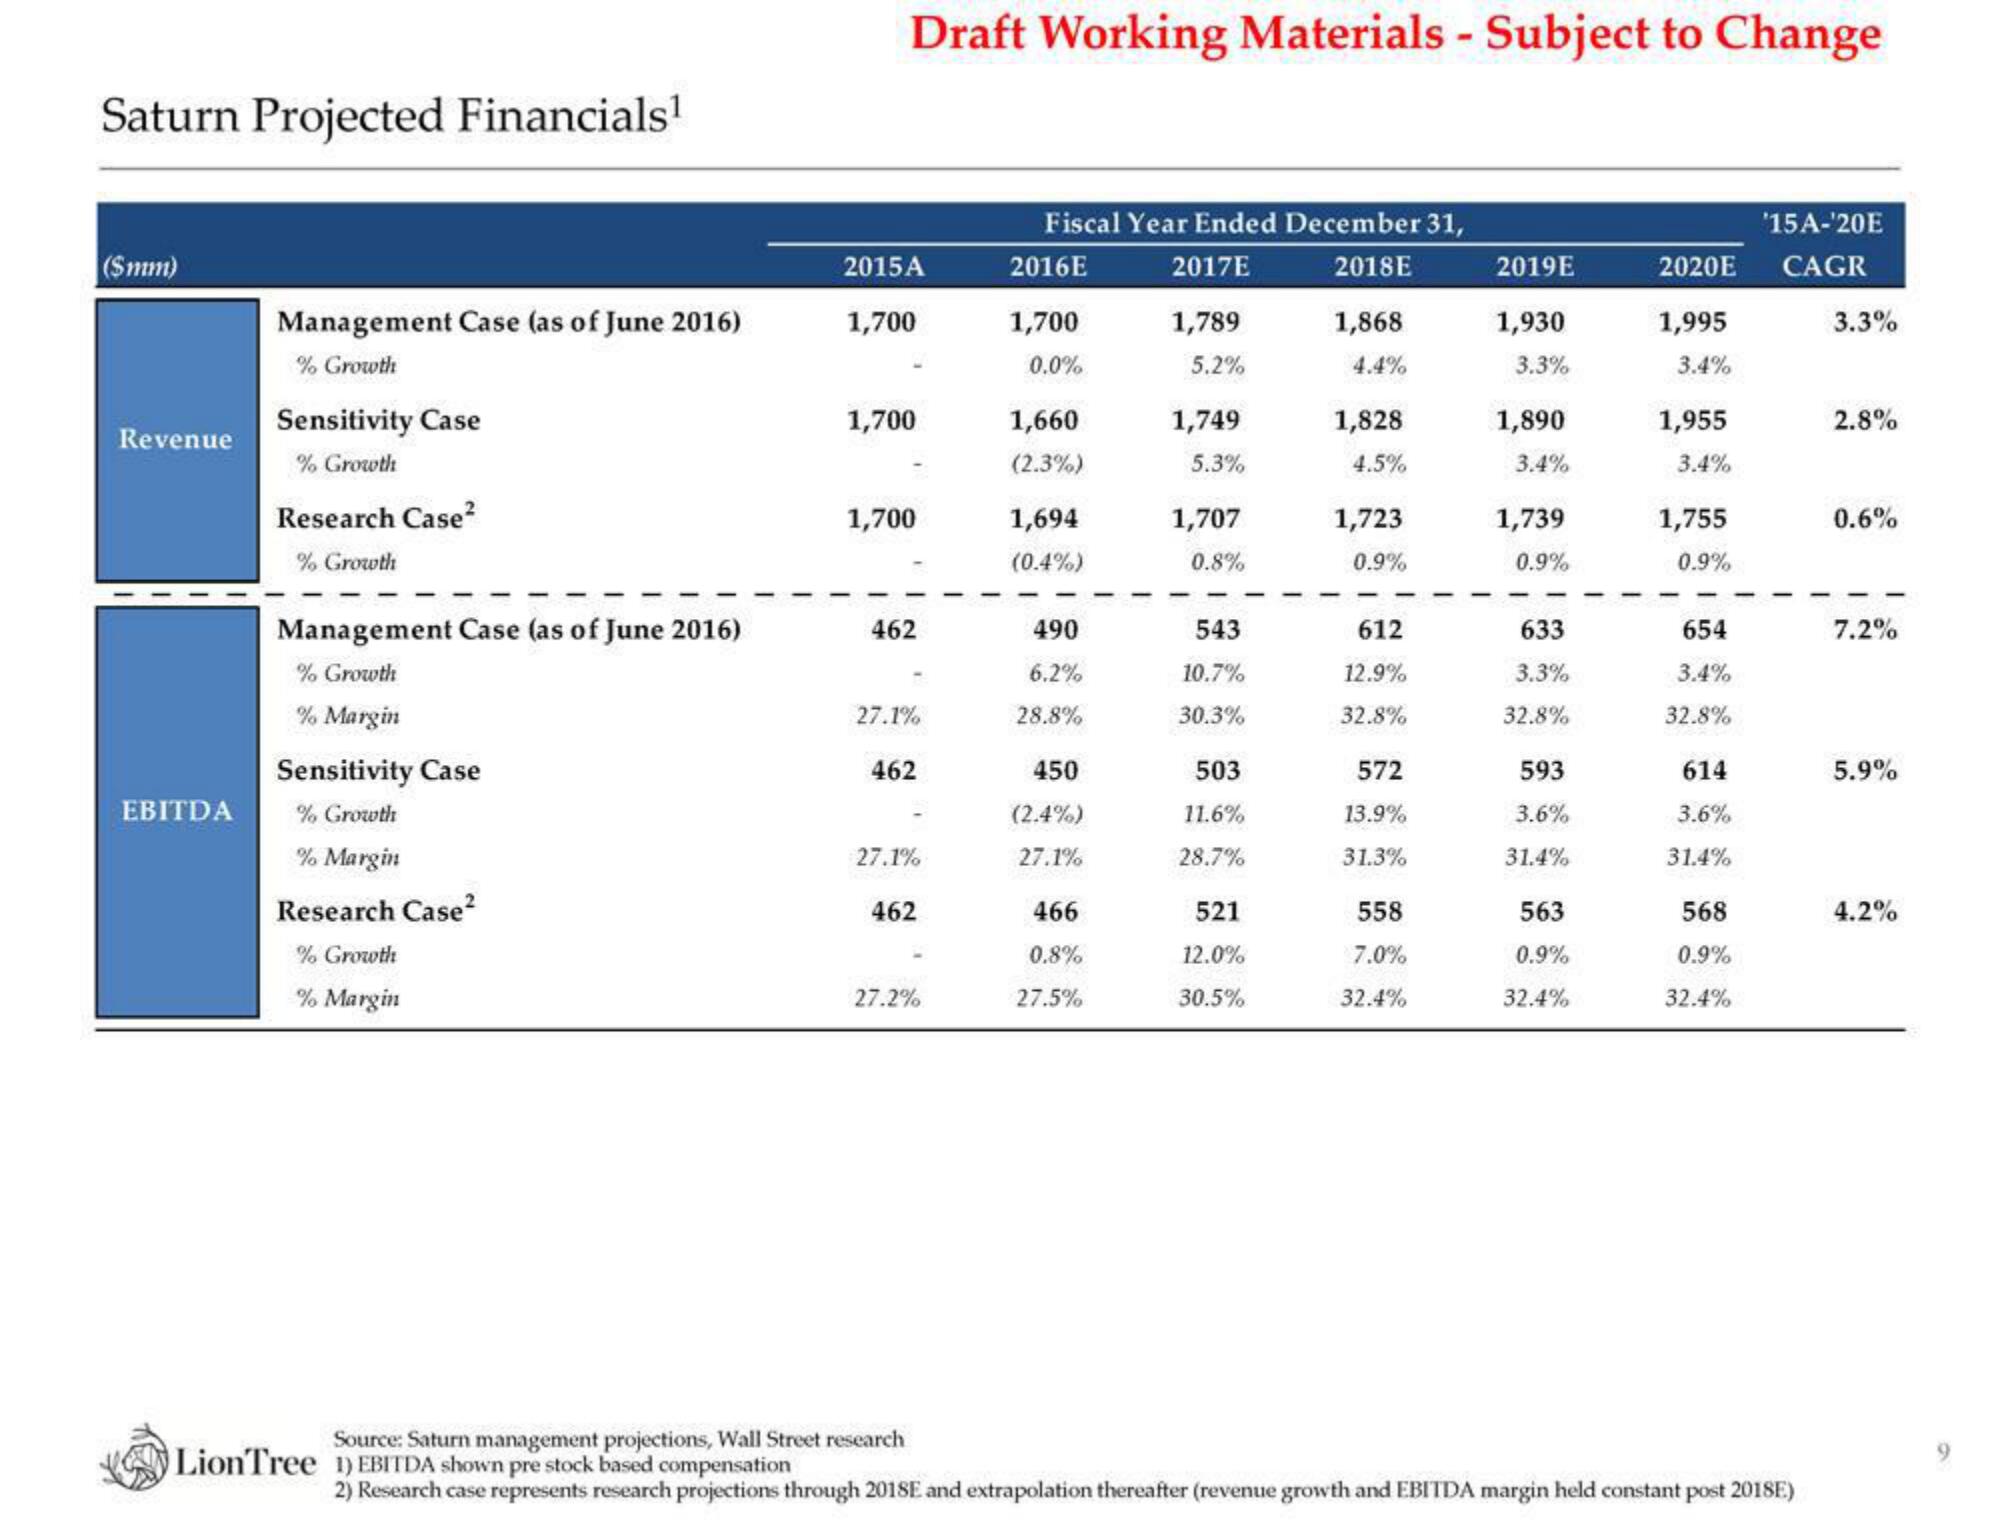
Saturn Projected Financials¹
($mm)
Revenue
EBITDA
Management Case (as of June 2016)
% Growth
Sensitivity Case
% Growth
Research Case²
% Growth
Management Case (as of June 2016)
% Growth
% Margin
Sensitivity Case
% Growth
% Margin
Research Case²
% Growth
% Margin
Draft Working Materials - Subject to Change
2015A
1,700
1,700
1,700
462
27.1%
462
27.1%
462
27.2%
Source: Saturn management projections, Wall Street research
LionTree 1) EBITDA shown pre stock based compensation
Fiscal Year Ended December 31,
2016E
2017E
2018E
1,700
0.0%
1,660
(2.3%)
1,694
(0.4%)
490
6.2%
28.8%
450
(2.4%)
27.1%
466
0.8%
27.5%
1,789
5.2%
1,749
5.3%
1,707
0.8%
543
10.7%
30.3%
503
11.6%
28.7%
521
12.0%
30.5%
1,868
4.4%
1,828
4.5%
1,723
0.9%
612
12.9%
32.8%
572
13.9%
31.3%
558
7.0%
32.4%
2019E
1,930
3.3%
1,890
3.4%
1,739
0.9%
633
3.3%
32.8%
593
3.6%
31.4%
563
0.9%
32.4%
'15A-¹20E
2020E CAGR
1,995
3.4%
1,955
3.4%
1,755
0.9%
654
3.4%
32.8%
614
3.6%
31.4%
568
0.9%
32.4%
2) Research case represents research projections through 2018E and extrapolation thereafter (revenue growth and EBITDA margin held constant post 2018E)
3.3%
2.8%
0.6%
7.2%
5.9%
4.2%View entire presentation