Vertical Aerospace SPAC Presentation Deck
$mm
Annual Aircraft Production (# Aircraft)
Aircraft Sales
Aircraft Services
Total Revenue
YOY Growth %
Aircraft Sales
Aircraft Services
Gross Profit
Gross Margin %
Operating Expenses
EBITDA
EBITDA Margin %
Less: Taxes
Less: Change in NWC
Less: Capex
Free Cash Flow¹
LONG TERM
BUSINESS PLAN
Source: Company estimates. 1. Calculated as EBITDA less taxes, capex and change in net working capital.
INVESTOR DECK 2021
2024E
50
180
12
192
98
2
100
52%
(109)
(9)
(5%)
1
(5)
(40)
(52)
2025E
250
846
85
931
384%
436
17
453
49%
(183)
270
29%
(63)
(18)
(63)
127
2026E
1,000
3,181
385
3,566
283%
1,543
77
1,620
45%
(264)
1,357
38%
(329)
(57)
(198)
772
2027E
1,500
4,485
939
5,424
52%
2,230
PRIVATE & CONFIDENTIAL
188
2,418
45%
(346)
2,072
38%
(503)
(94)
(212)
1,263
2028E
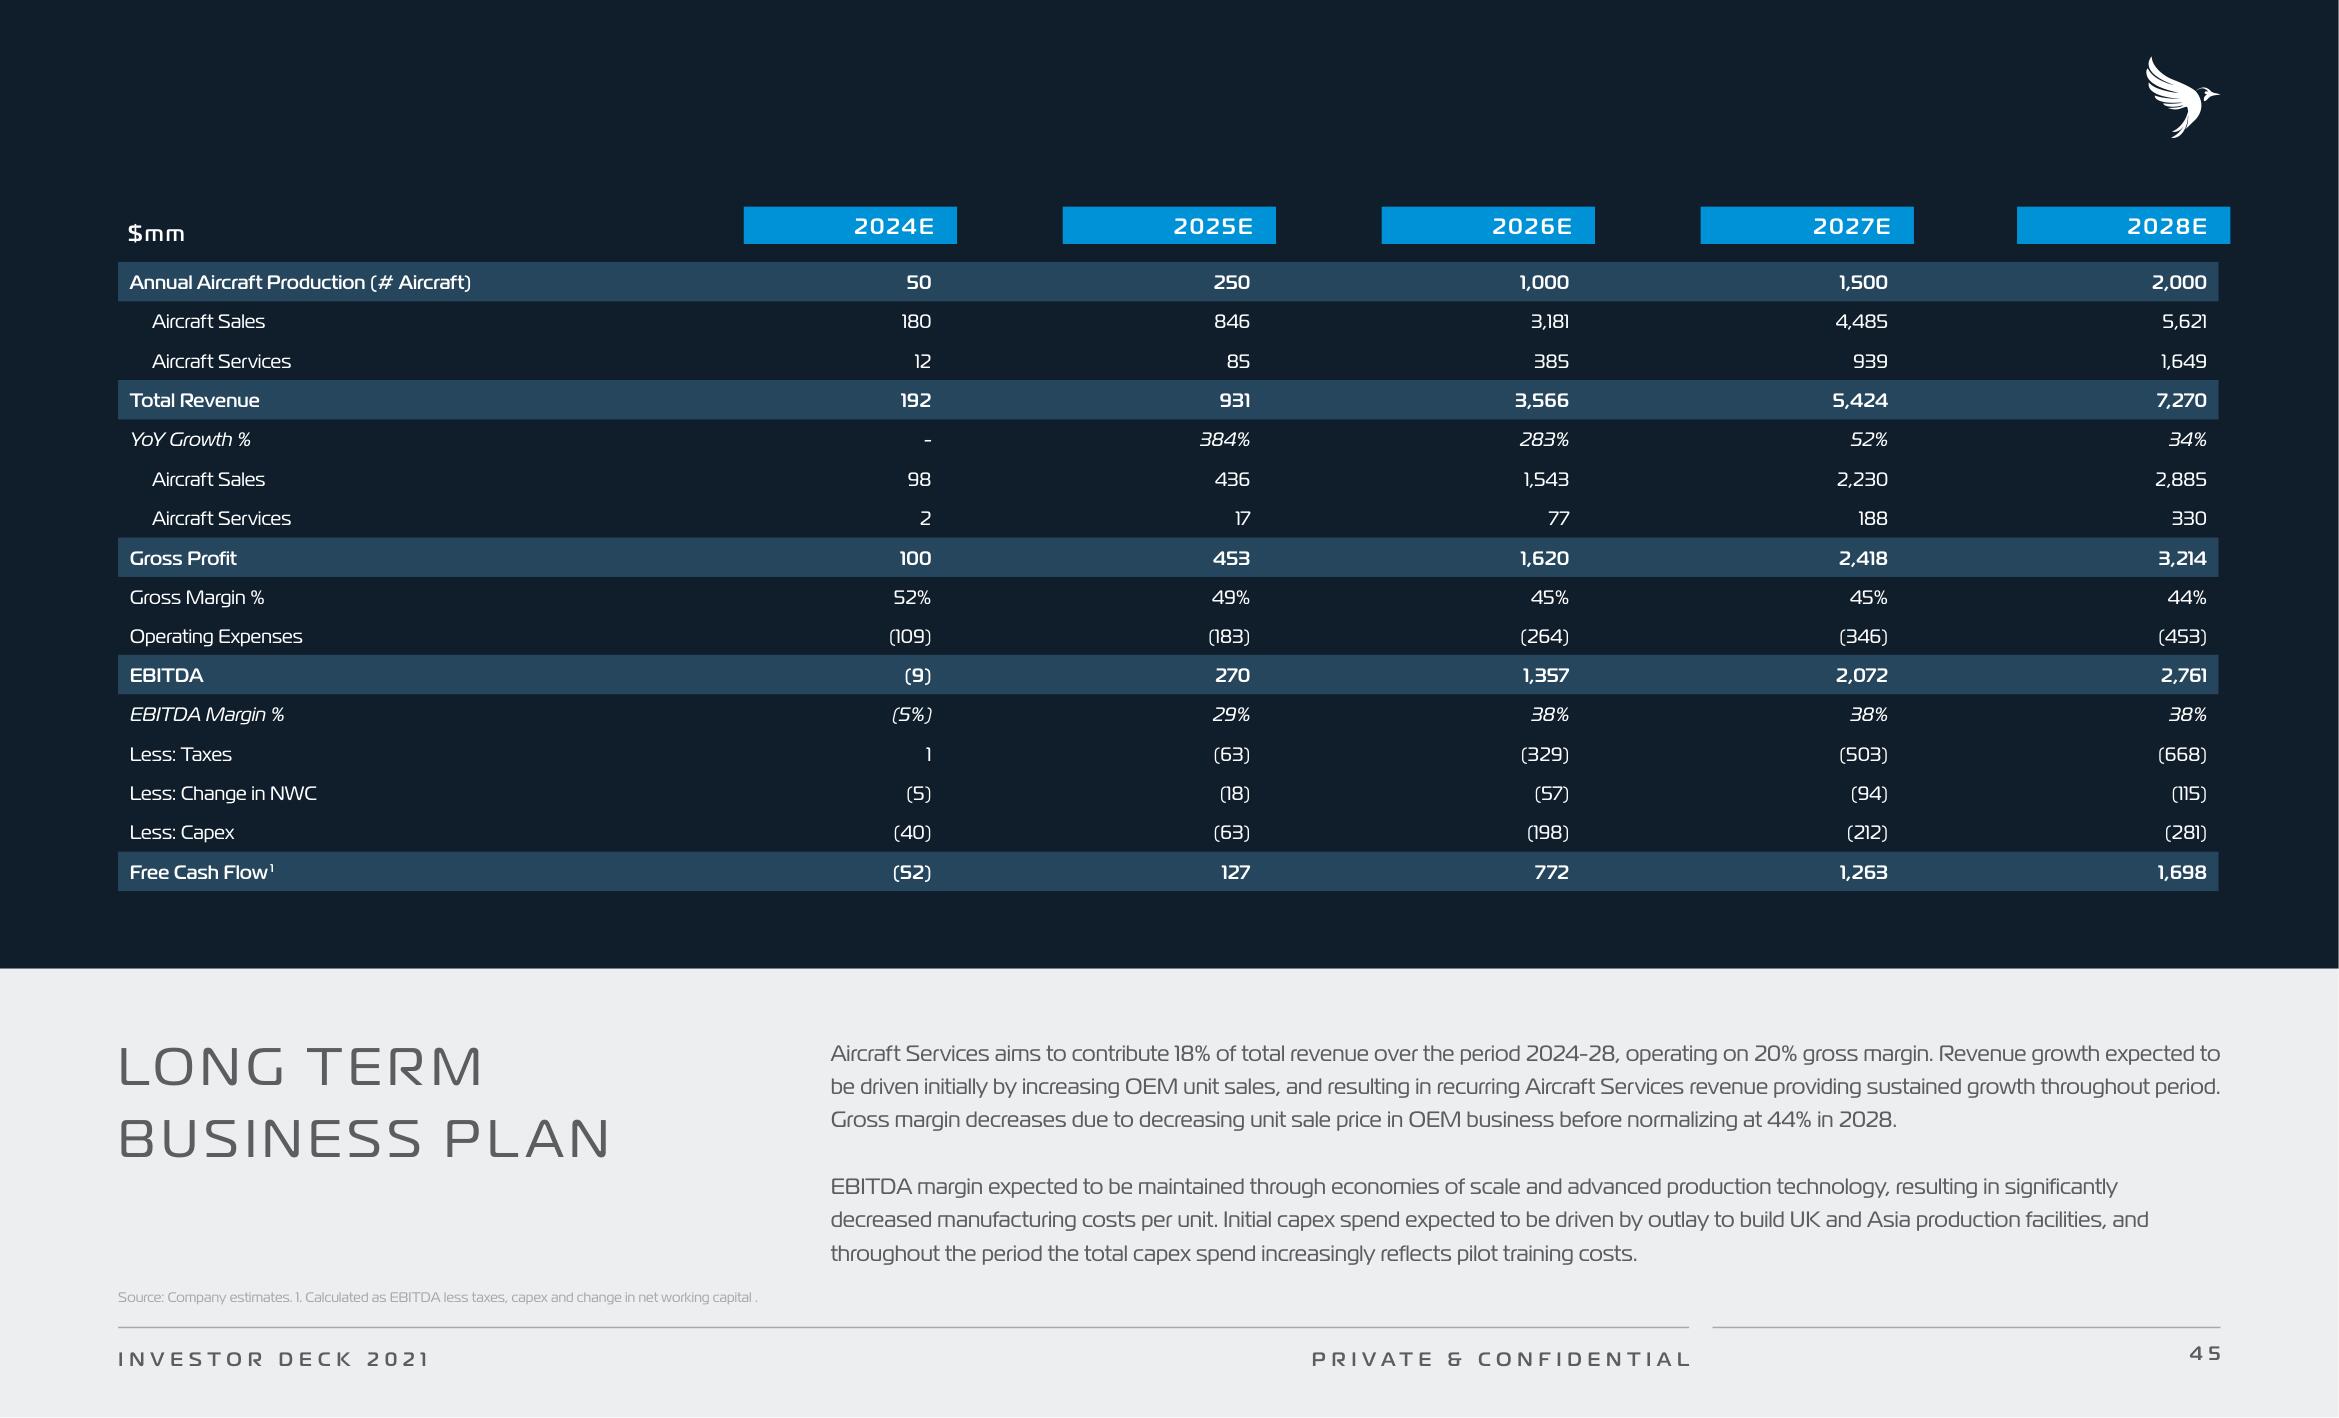
EBITDA margin expected to be maintained through economies of scale and advanced production technology, resulting in significantly
decreased manufacturing costs per unit. Initial capex spend expected to be driven by outlay to build UK and Asia production facilities, and
throughout the period the total capex spend increasingly reflects pilot training costs.
2,000
5,621
1,649
7,270
34%
2,885
330
3,214
44%
(453)
2,761
38%
Aircraft Services aims to contribute 18% of total revenue over the period 2024-28, operating on 20% gross margin. Revenue growth expected to
be driven initially by increasing OEM unit sales, and resulting in recurring Aircraft Services revenue providing sustained growth throughout period.
Gross margin decreases due to decreasing unit sale price in OEM business before normalizing at 44% in 2028.
(668)
(115)
(281)
1,698
45View entire presentation