Mondee Investor Presentation Deck
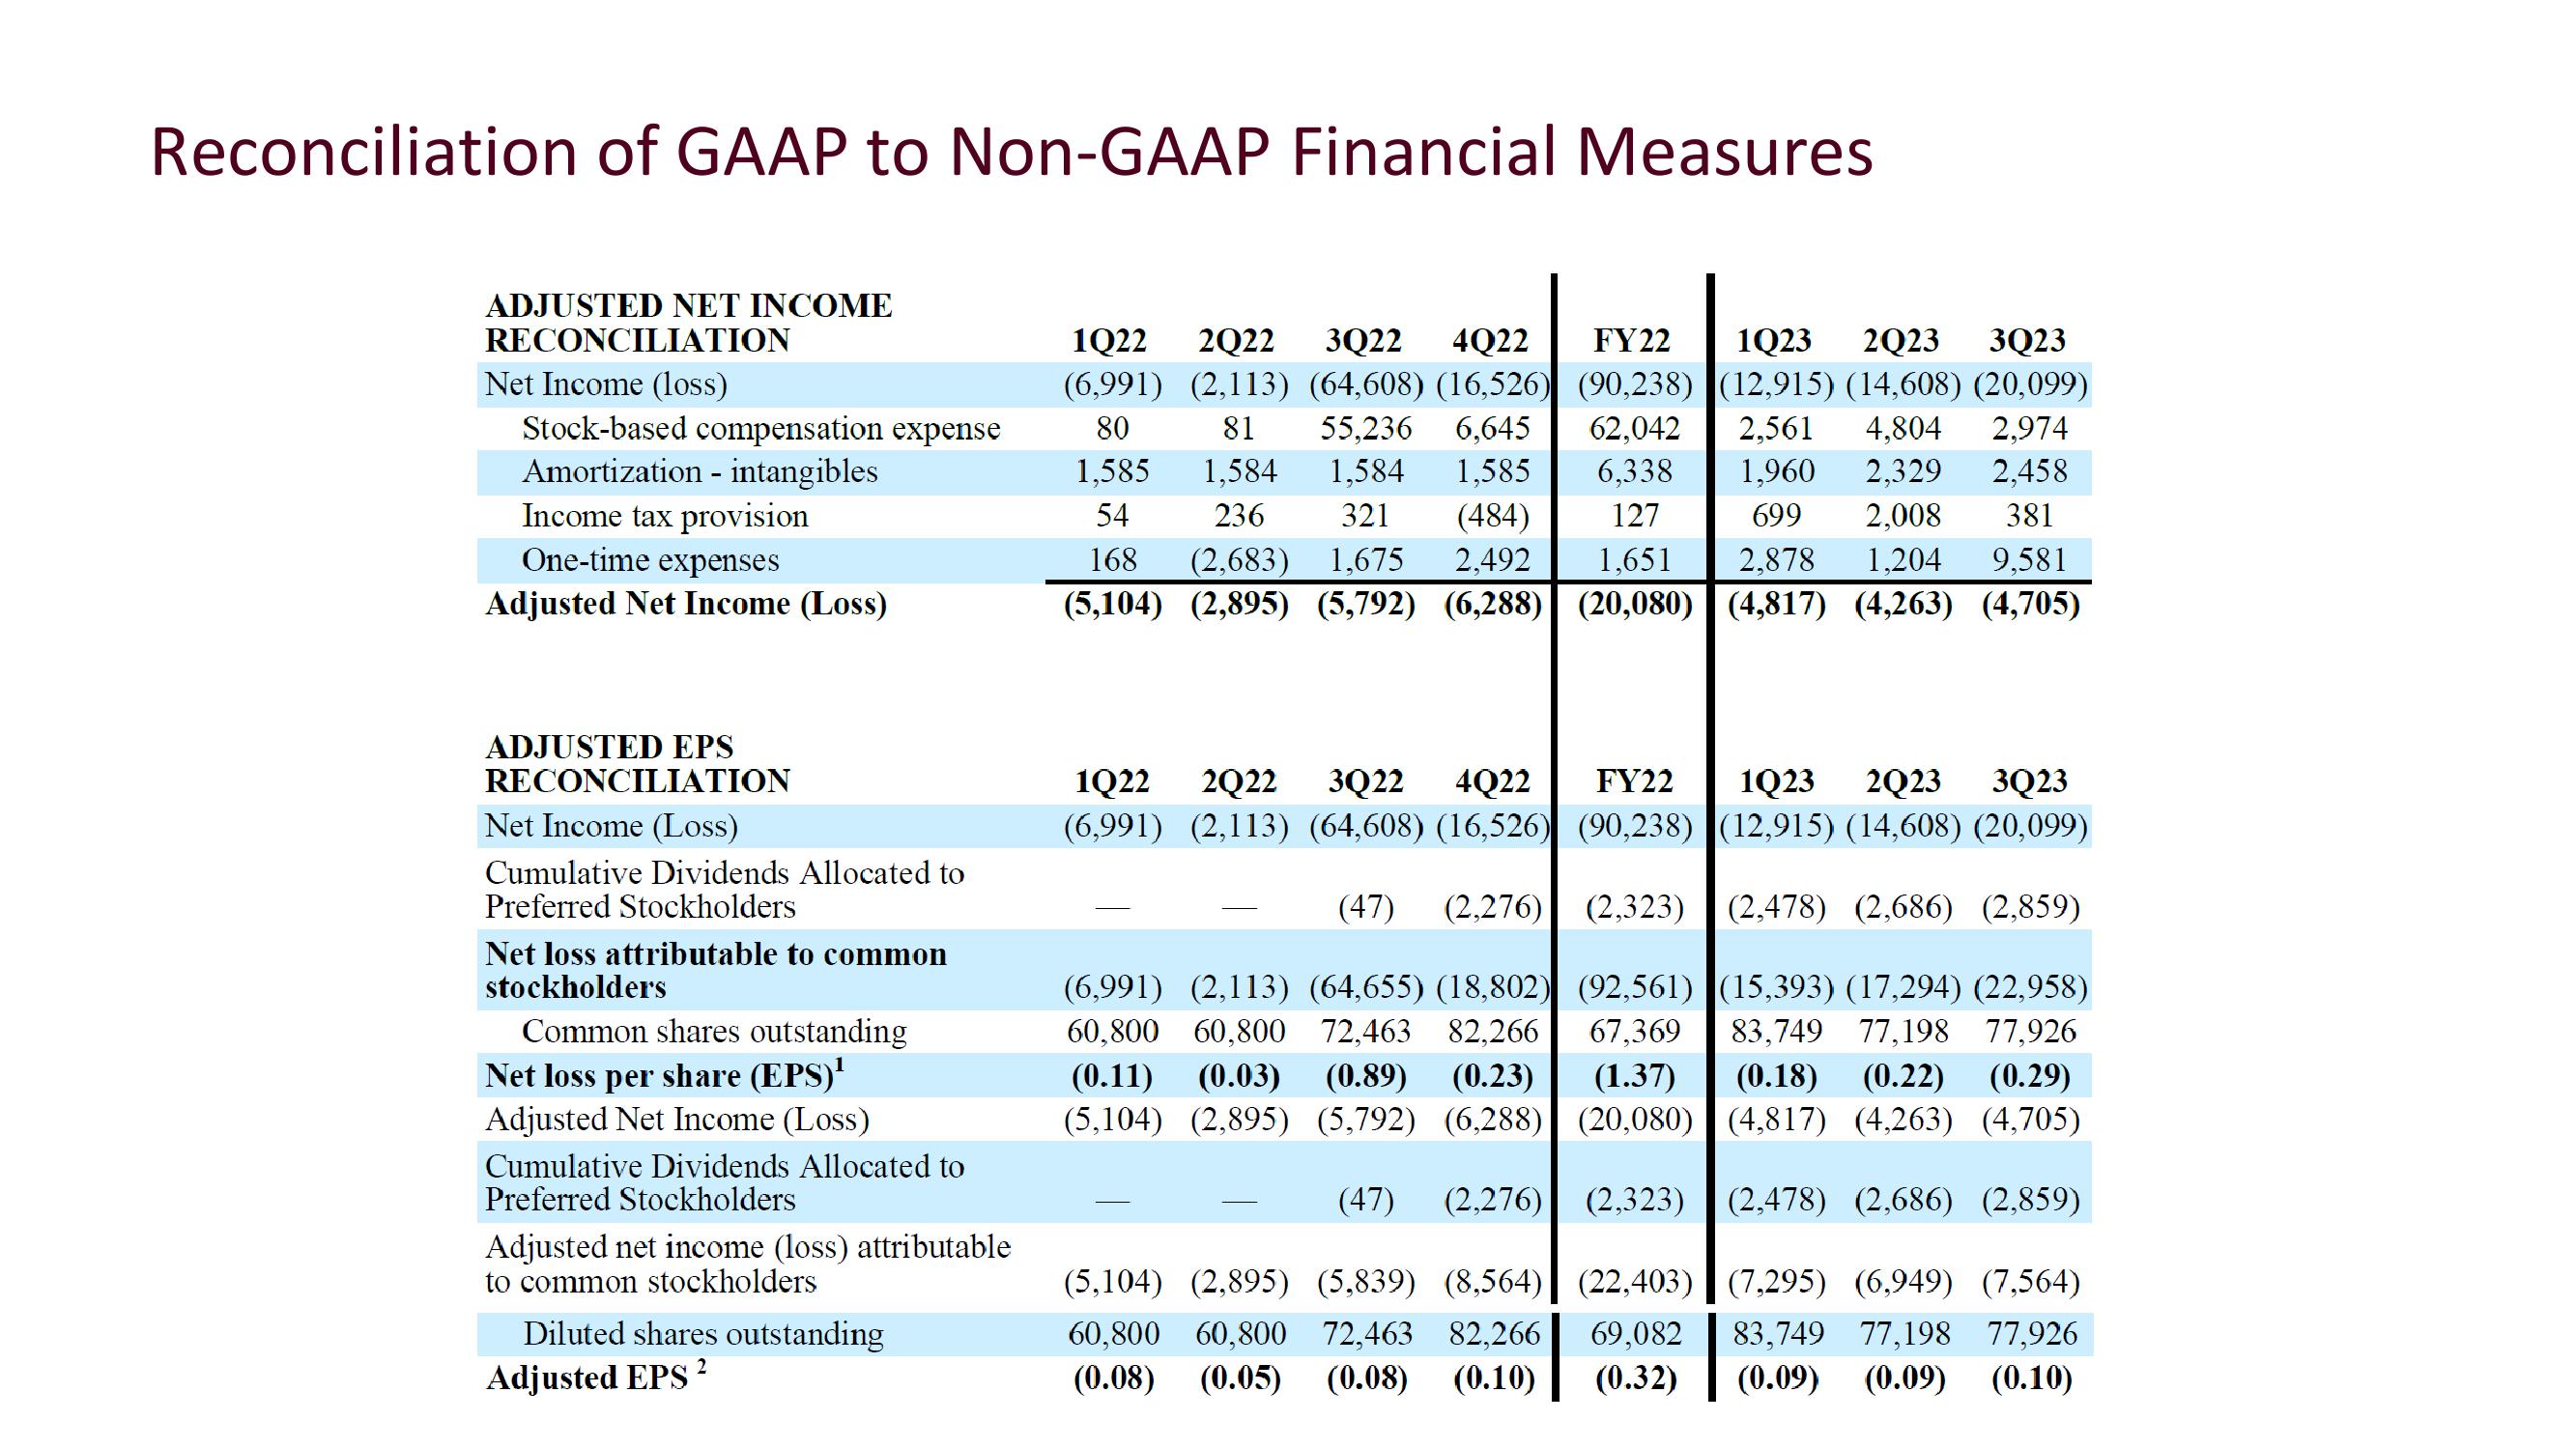
Reconciliation of GAAP to Non-GAAP Financial Measures
ADJUSTED NET INCOME
RECONCILIATION
Net Income (loss)
Stock-based compensation expense
Amortization - intangibles
Income tax provision
One-time expenses
Adjusted Net Income (Loss)
ADJUSTED EPS
RECONCILIATION
Net Income (Loss)
Cumulative Dividends Allocated to
Preferred Stockholders
Net loss attributable to common
stockholders
Common shares outstanding
Net loss per share (EPS)¹
Adjusted Net Income (Loss)
Cumulative Dividends Allocated to
Preferred Stockholders
Adjusted net income (loss) attributable
to common stockholders
Diluted shares outstanding
2
Adjusted EPS
81
1Q22 2Q22 3Q22 4Q22 FY22 1Q23 2Q23 3Q23
(6,991) (2,113) (64,608) (16,526) (90,238) (12,915) (14,608) (20,099)
80
55,236 6,645 62,042 2,561 4,804 2,974
1,584
1,584 1,585 6,338 1,960 2,329 2,458
236 321 (484) 127 699 2,008
381
(2,683) 1,675 2,492 1,651 2,878 1,204 9,581
(20,080) (4,817) (4,263) (4,705)
1,585
54
168
(5,104) (2,895) (5,792) (6,288)
1Q22 2022 3Q22 4Q22 FY22
(6,991) (2,113) (64,608) (16,526) (90,238)
(47) (2,276) (2,323)
(6,991) (2,113) (64,655) (18,802) (92,561)
60,800 60,800 72,463 82,266
(0.89) (0.23)
67,369
(0.11) (0.03)
(1.37)
(5,104) (2,895) (5,792) (6,288) (20,080)
(47) (2,276) (2,323)
(5,104) (2,895) (5,839) (8,564)|| (22,403)
60,800 60,800 72,463 82,266 69,082
(0.08) (0.05) (0.08) (0.10) (0.32)
1Q23 2Q23 3Q23
(12,915) (14,608) (20,099)
(2,478) (2,686) (2,859)
(15,393) (17,294) (22,958)
83,749 77,198 77,926
(0.18) (0.22) (0.29)
(4,817) (4,263) (4,705)
(2,478) (2,686) (2,859)
(7,295) (6,949) (7,564)
83,749 77,198 77,926
(0.09) (0.09) (0.10)View entire presentation