Eos Energy Investor Presentation Deck
Strategic Framework
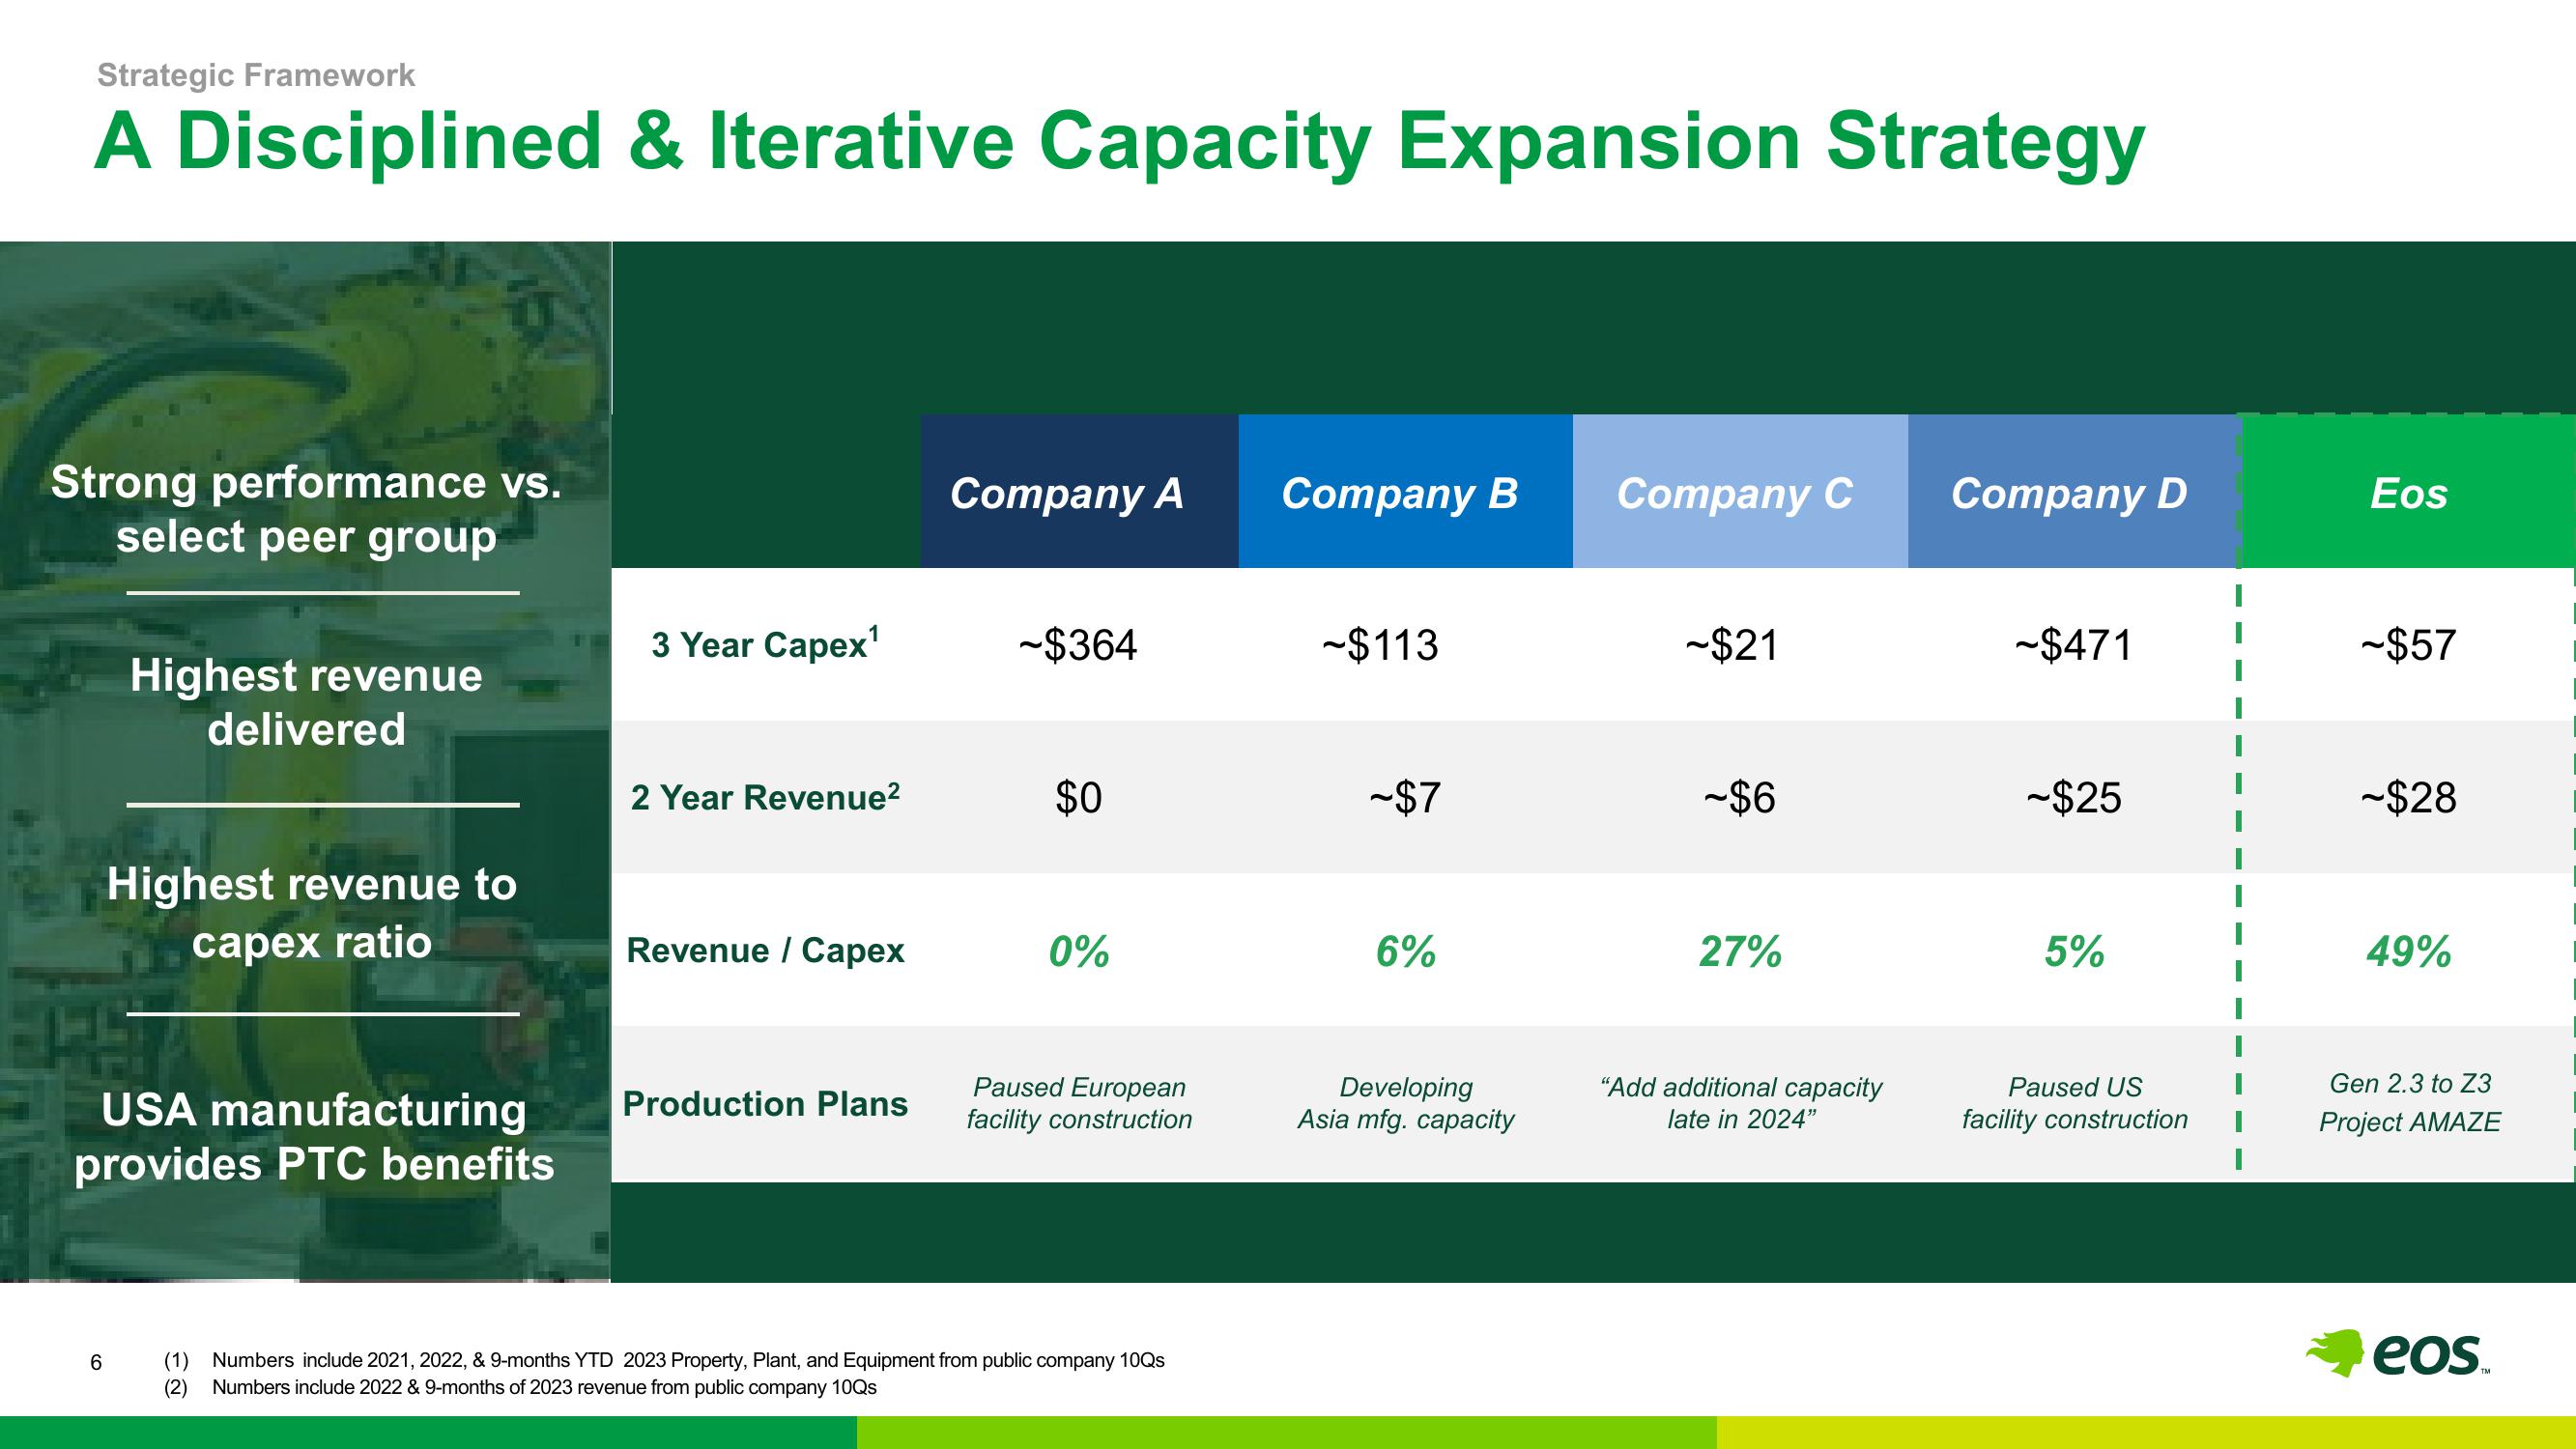
A Disciplined & Iterative Capacity Expansion Strategy
Strong performance vs.
select peer group
Highest revenue
delivered
6
Highest revenue to
capex ratio
USA manufacturing
provides PTC benefits
3 Year Capex¹
2 Year Revenue²
Revenue / Capex
Production Plans
Company A Company B
-$364
$0
0%
Paused European
facility construction
(1) Numbers include 2021, 2022, & 9-months YTD 2023 Property, Plant, and Equipment from public company 10Qs
(2) Numbers include 2022 & 9-months of 2023 revenue from public company 10Qs
-$113
~$7
6%
Developing
Asia mfg. capacity
Company C
-$21
-$6
27%
"Add additional capacity
late in 2024"
Company D
-$471
-$25
5%
Paused US
facility construction
Eos
-$57
-$28
49%
Gen 2.3 to Z3
Project AMAZE
eosView entire presentation