OppFi Results Presentation Deck
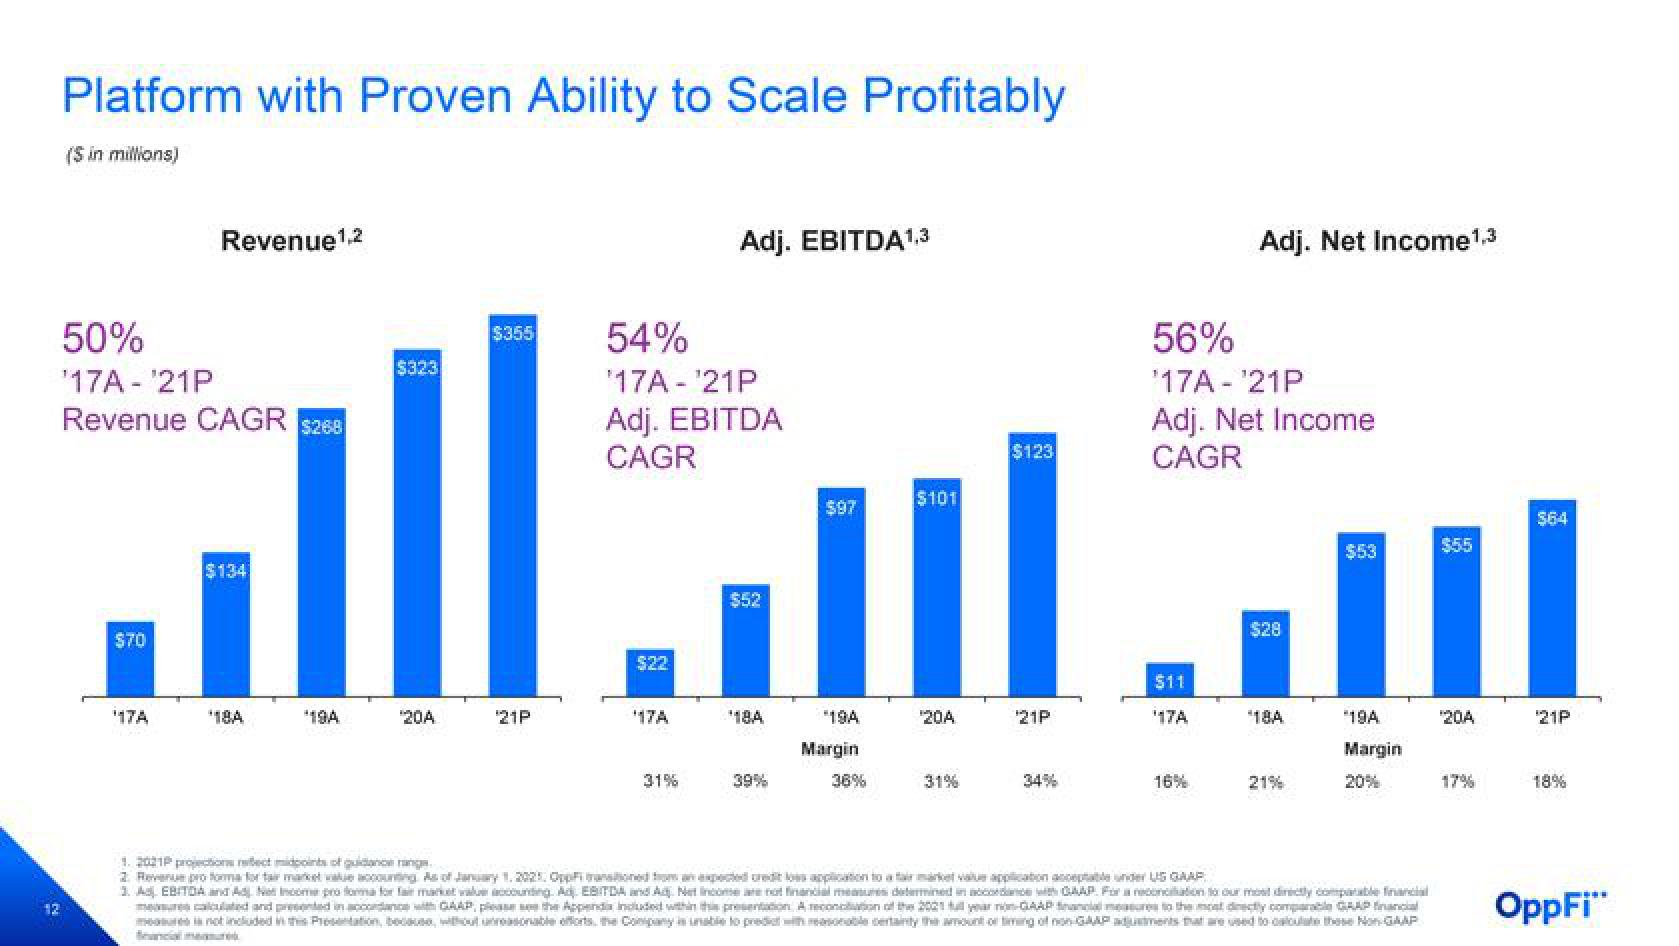
Platform with Proven Ability to Scale Profitably
($ in millions)
50%
¹17A-21P
Revenue CAGR $268
$70
Revenue ¹,2
¹17A
$134
'18A
*19A
$323
¹20A
$355
21P
54%
17A-¹21P
Adj. EBITDA
CAGR
$22
¹17A
Adj. EBITDA¹,3
31%
$52
¹18A
39%
$97
*19A
Margin
36%
$101
¹20A
31%
$123
¹21P
34%
56%
¹17A-¹21P
Adj. Net Income
CAGR
$11
¹17A
Adj. Net Income ¹.3
16%
$28
*18A
21%
$53
*19A
Margin
20%
1. 2021P projections refect doints of guidance range
2 Revenue proforma for tar market value accounting As of January 1, 2025, Oppfi transitioned from an expected credit les application to a fair market value application acceptable under US GAAP
3. As EBITDA and Ad Not Income pro forma forfait market value accounting. Ad. EBITDA and Ad. Net Income are not financial measures determined in accordance with CAP. For a conciliation to our most directly compatible financial
measures calculated and presented in accordance with GAAP, please see the Appendia included within this presentation. A reconciation of the 2021 full year non-GAAP financial measures to the most directly comparable GAAP financial
$55
¹20A
17%
$64
21P
18%
OppFi"View entire presentation