Innovid SPAC Presentation Deck
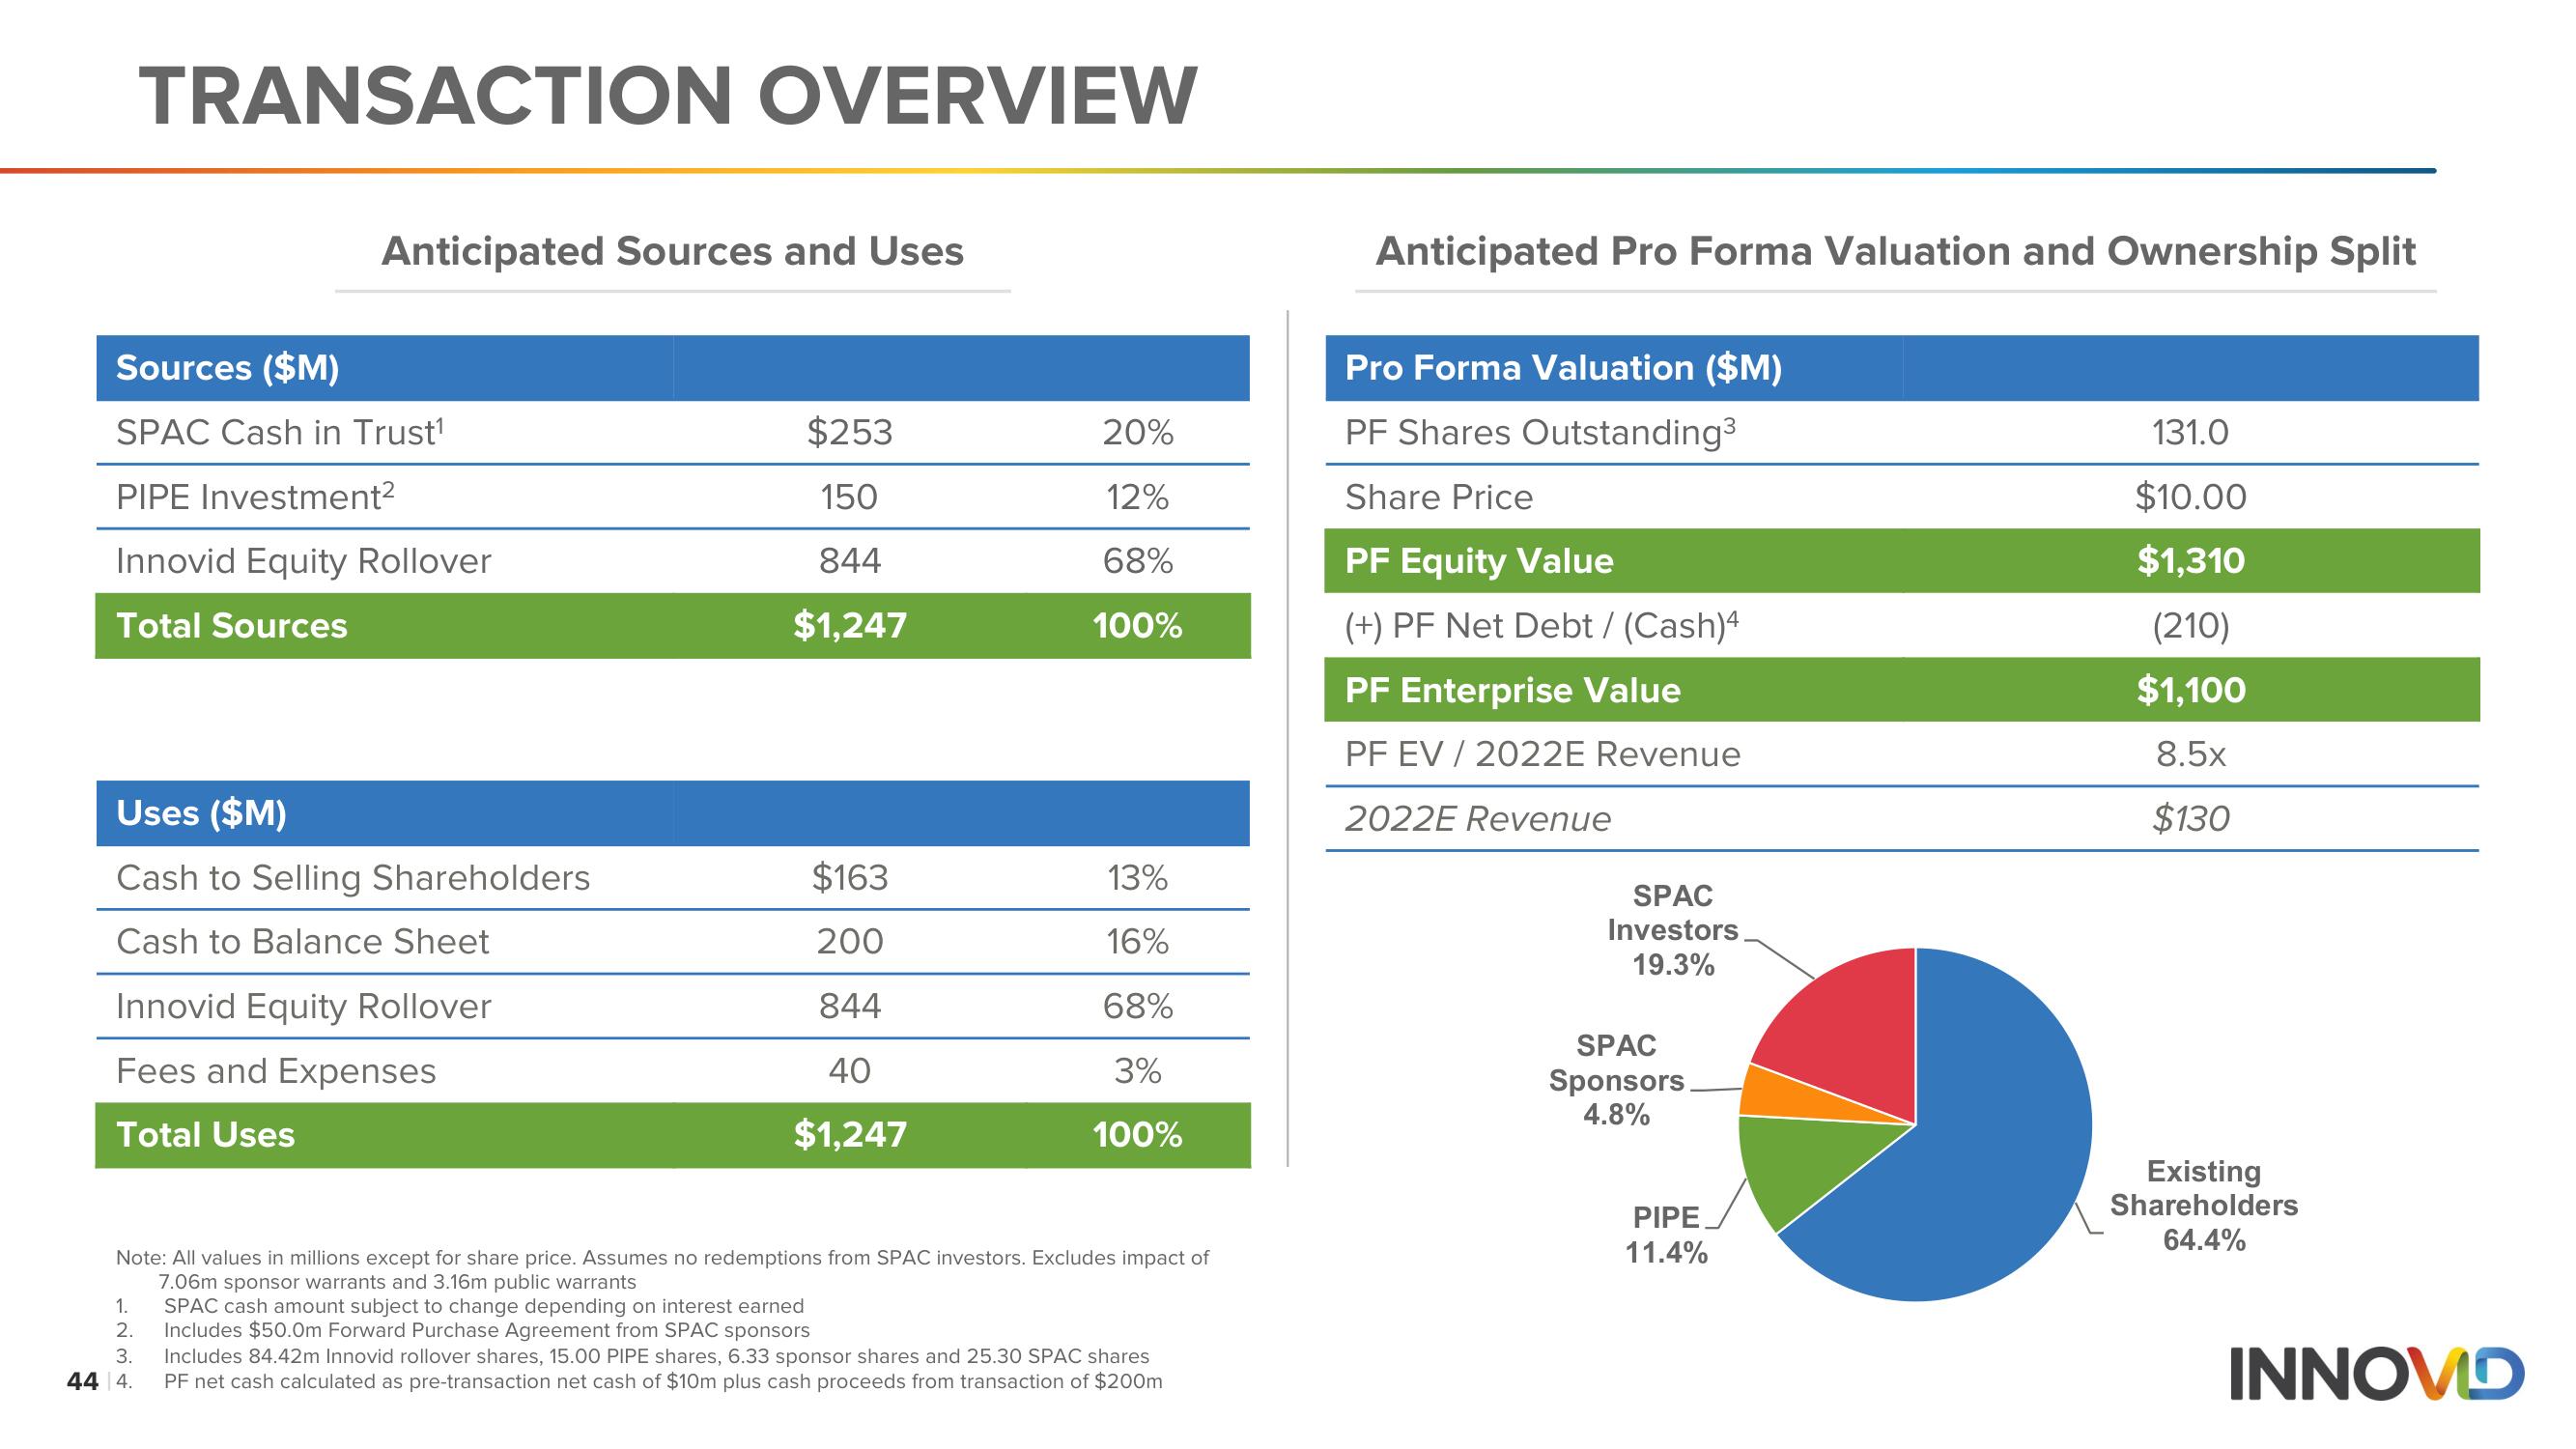
TRANSACTION OVERVIEW
Sources ($M)
SPAC Cash in Trust¹
PIPE Investment²
Innovid Equity Rollover
Total Sources
Anticipated Sources and Uses
Uses ($M)
Cash to Selling Shareholders
Cash to Balance Sheet
Innovid Equity Rollover
Fees and Expenses
Total Uses
1.
2.
3.
44 4.
$253
150
844
$1,247
$163
200
844
40
$1,247
20%
12%
68%
100%
Note: All values in millions except for share price. Assumes no redemptions from SPAC investors. Excludes impact of
7.06m sponsor warrants and 3.16m public warrants
SPAC cash amount subject to change depending on interest earned
Includes $50.0m Forward Purchase Agreement from SPAC sponsors
13%
16%
68%
3%
100%
Includes 84.42m Innovid rollover shares, 15.00 PIPE shares, 6.33 sponsor shares and 25.30 SPAC shares
PF net cash calculated as pre-transaction net cash of $10m plus cash proceeds from transaction of $200m
Anticipated Pro Forma Valuation and Ownership Split
Pro Forma Valuation ($M)
PF Shares Outstanding³
Share Price
PF Equity Value
(+) PF Net Debt / (Cash)4
PF Enterprise Value
PF EV / 2022E Revenue
2022E Revenue
SPAC
Investors
19.3%
SPAC
Sponsors
4.8%
PIPE
11.4%
131.0
$10.00
$1,310
(210)
$1,100
8.5x
$130
Existing
Shareholders
64.4%
INNOVDView entire presentation