Cadre Holdings IPO Presentation Deck
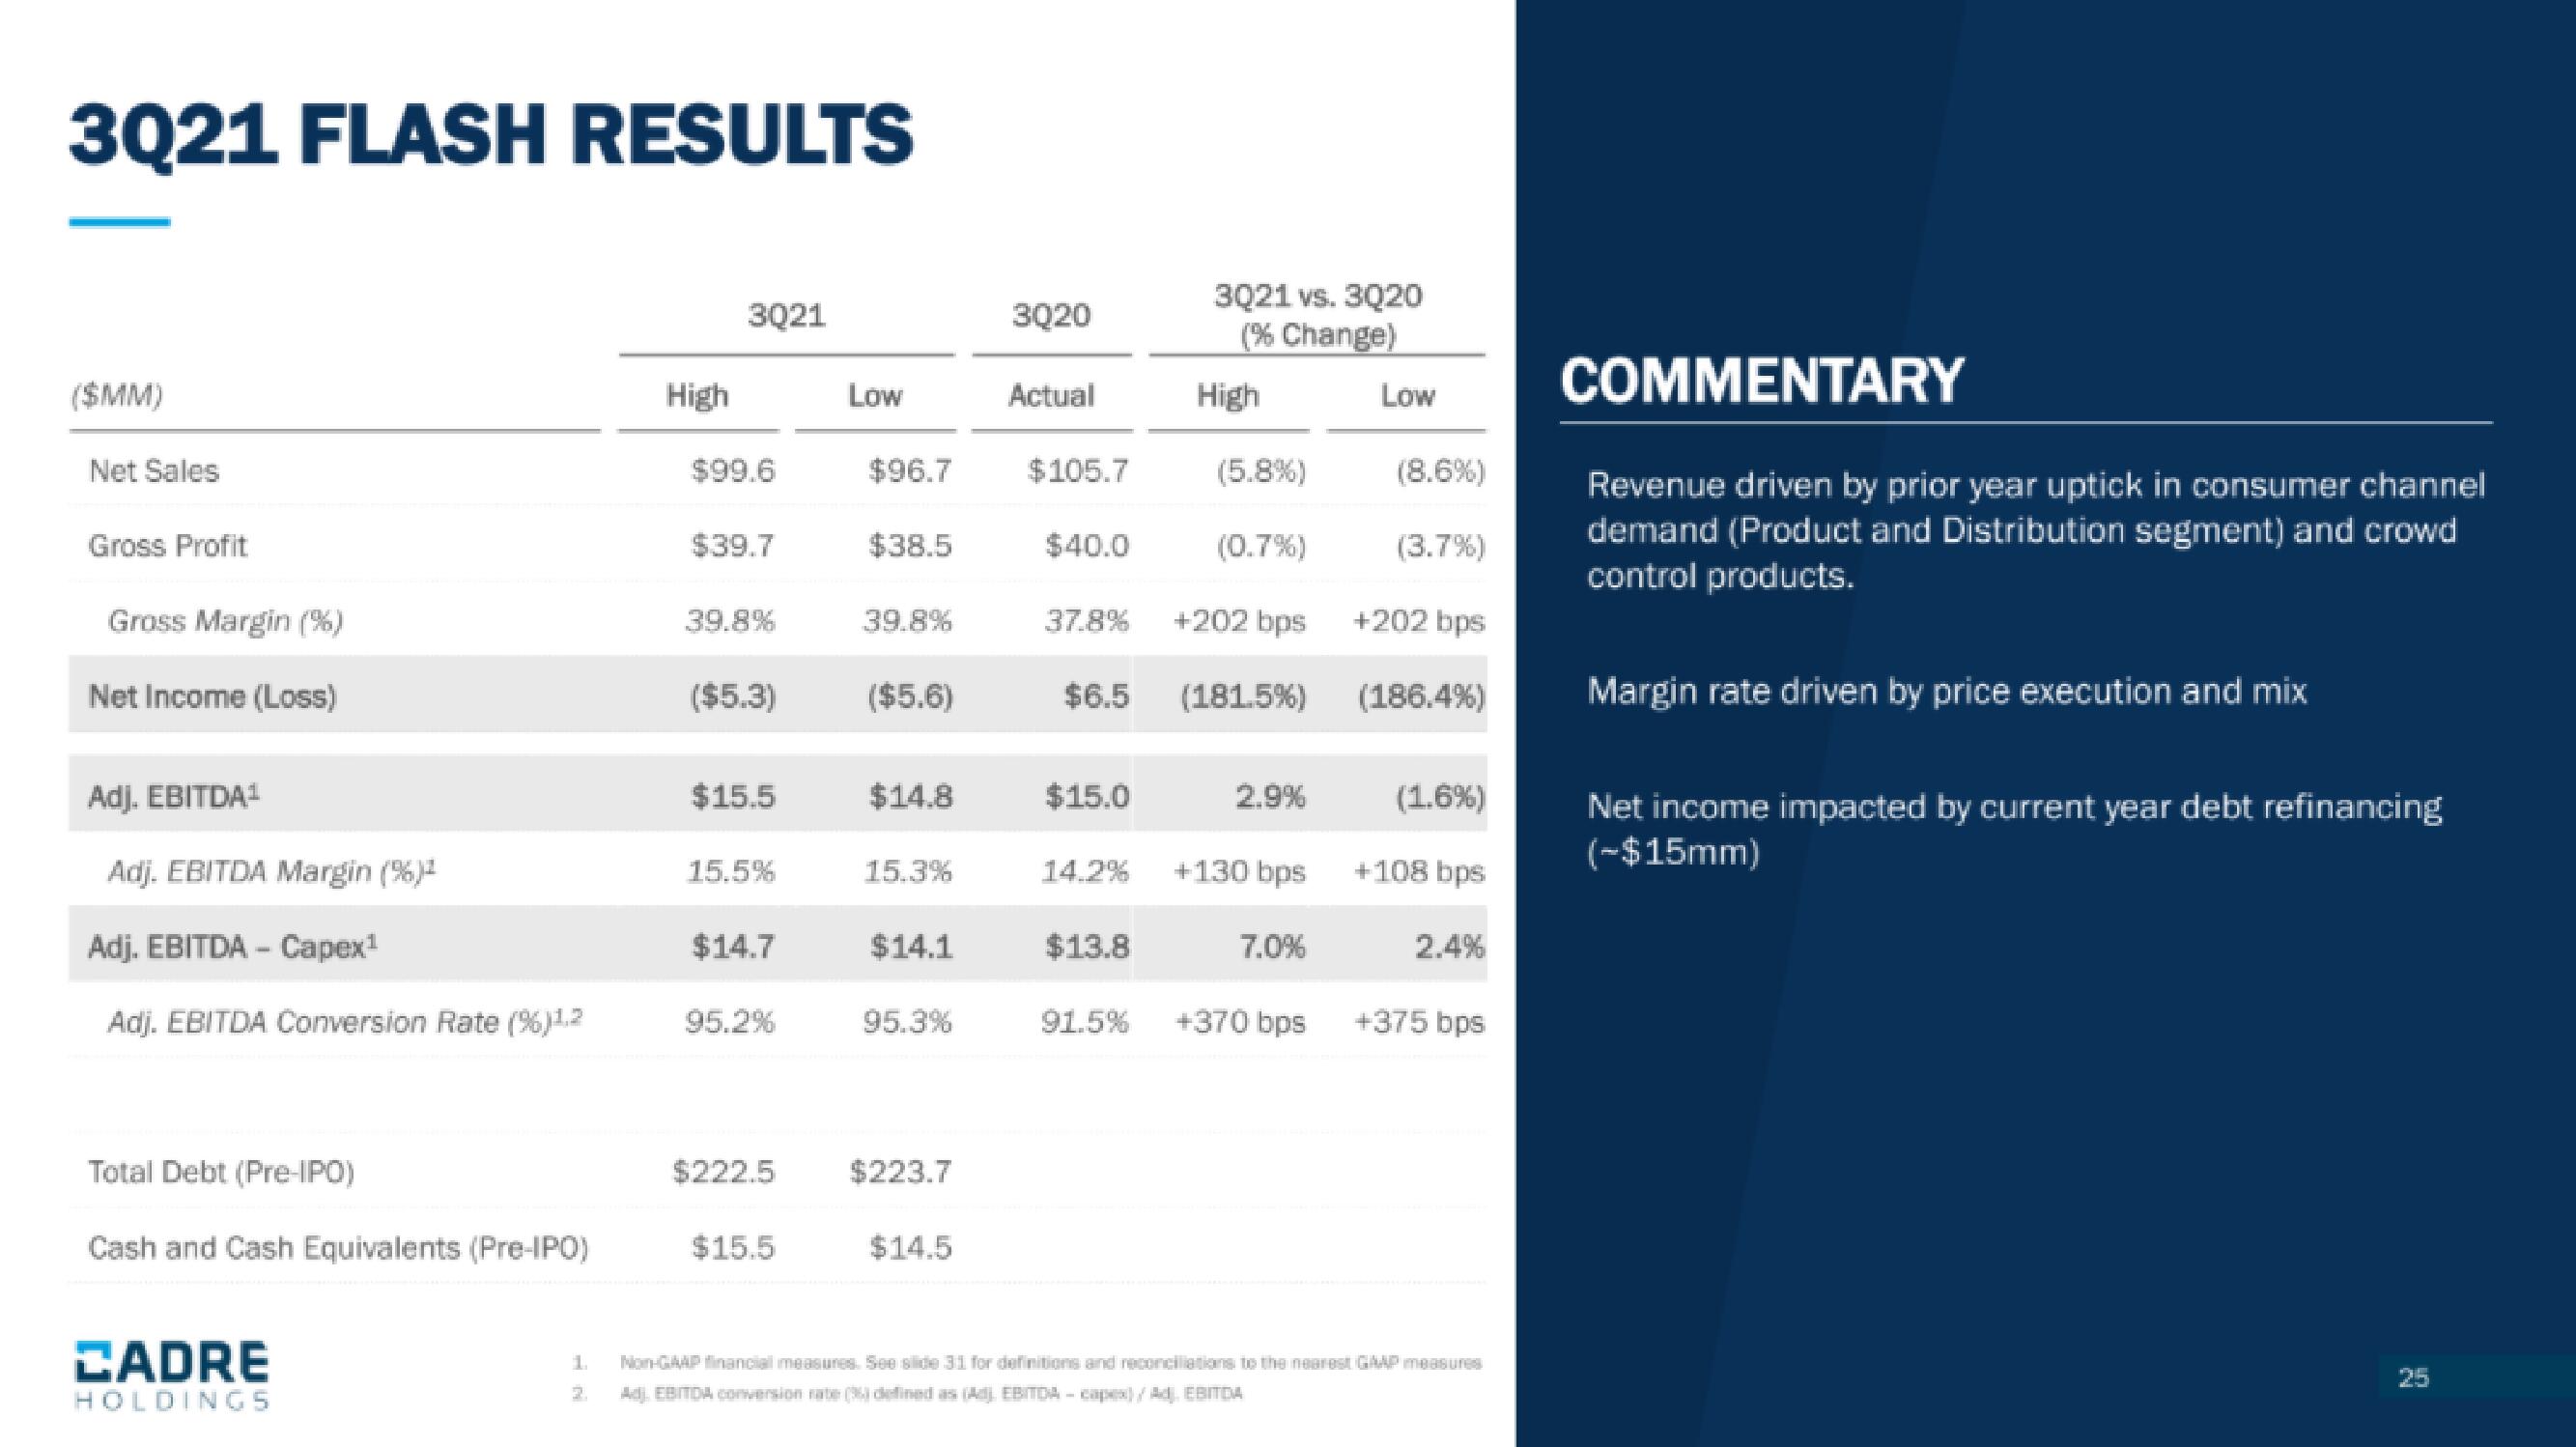
3021 FLASH RESULTS
($MM)
Net Sales
Gross Profit
Gross Margin (%)
Net Income (Loss)
Adj. EBITDA¹
Adj. EBITDA Margin (%)¹
Adj. EBITDA-Capex¹
Adj. EBITDA Conversion Rate (%)1.2
Total Debt (Pre-IPO)
Cash and Cash Equivalents (Pre-IPO)
CADRE
HOLDINGS
1
High
3Q21
$99.6
$39.7
39.8%
($5.3)
$15.5
15.5%
$14.7
95.2%
$222.5
$15.5
Low
$96.7
$38.5
39.8%
($5.6)
$14.8
15.3%
$14.1
95.3%
$223.7
$14.5
3Q20
Actual
$105.7
$40.0
37.8%
$6.5
$15.0
14.2%
$13.8
91.5%
3021 vs. 3020
(% Change)
High
(5.8%)
(0.7%)
+202 bps
(181.5%)
2.9%
+130 bps
7.0%
Low
(8.6%)
(3.7%)
+202 bps
(186.4%)
(1.6%)
+108 bps
2.4%
+370 bps +375 bps
Non-GAAP financial measures. See slide 31 for definitions and reconciliations to the nearest GAAP measures
Adj. EBITDA conversion rate (36) defined as (Adj. EBITDA-capex) / A. EBITDA
COMMENTARY
Revenue driven by prior year uptick in consumer channel
demand (Product and Distribution segment) and crowd
control products.
Margin rate driven by price execution and mix
Net income impacted by current year debt refinancing
(-$15mm)View entire presentation